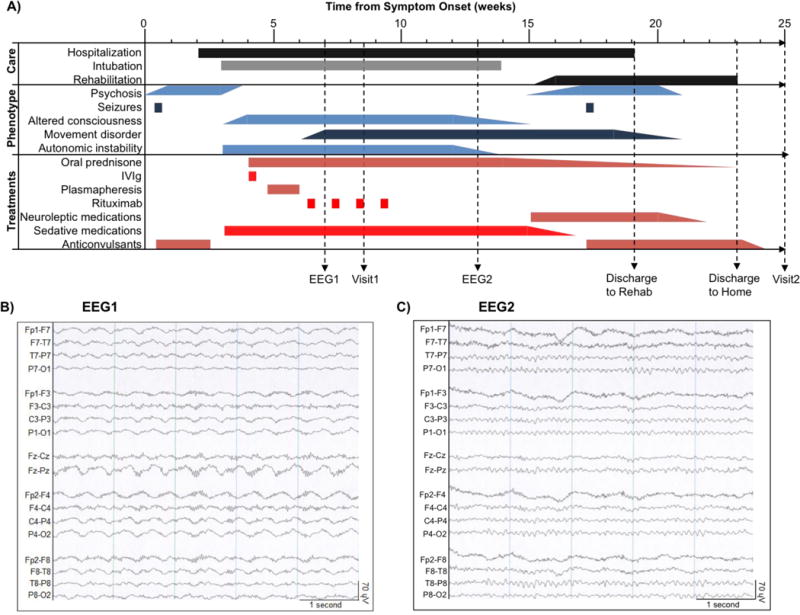
Figure 1.

Clinical course and interventions. A: Line diagram (from time of symptom onset) depicting landmarks in clinical care, emergence of symptoms and signs (phenotype), treatments and the timing of electroencephalograms (EEG1 and EEG2) and structural / functional neuroimaging (Visit1 and Visit2). B: Abnormal EEG showing diffuse, rhythmic, delta activity at 1–3 Hz with superimposed bursts of rhythmic 20–30 Hz beta frequency activity riding on each delta wave (“extreme delta brush”[48]). C: Normal EEG with characteristic posterior-dominant alpha rhythm (8–13 Hz).
