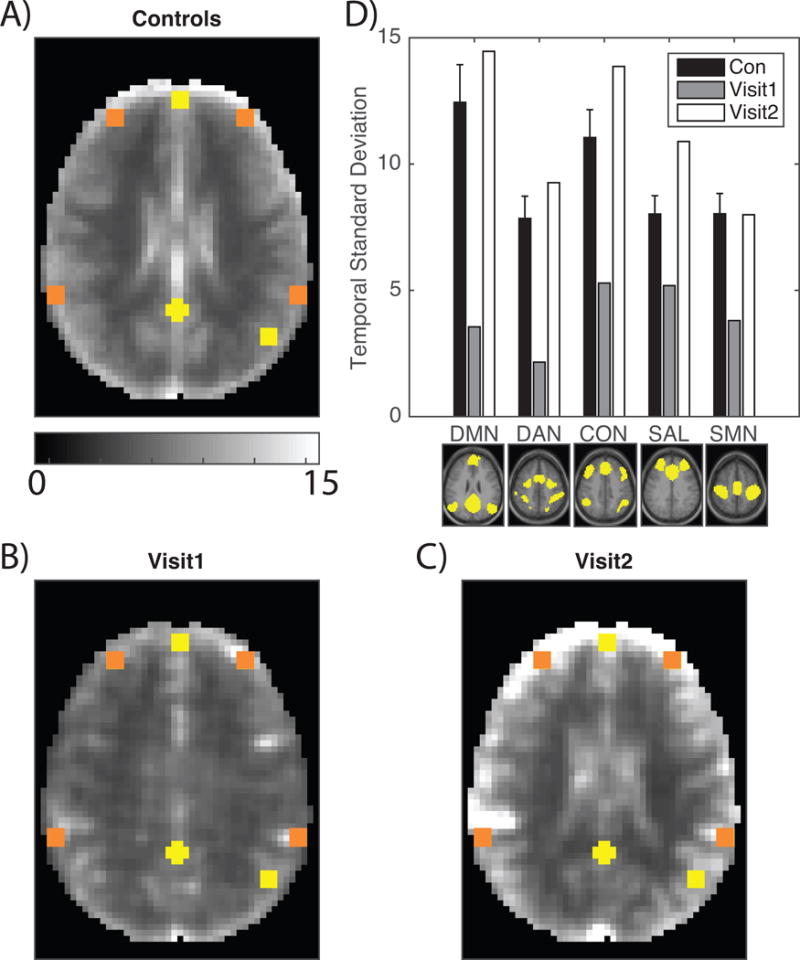
Figure 2.

BOLD signal amplitude is diminished in a patient with NMDAR encephalitis. A: Mean BOLD temporal standard deviation derived from 45 age-matched healthy individuals. Yellow boxes correspond to DMN ROIs and orange boxes correspond to non-DMN ROIs. The control group demonstrates strong grey versus white matter contrast. B: Temporal standard deviation at Visit1 in the same style as A. Grey versus white matter contrast is markedly diminished and the overall amplitude is reduced. C: Temporal standard deviation at Visit2 in the same style as A. Grey versus white matter contrast is restored and the overall amplitude is restored. D: The temporal standard deviation of the BOLD signal measured in ROIs from each of 5 RSNs shown below the corresponding set of bars. Black bars indicate healthy individuals (±1 standard deviation); grey bars correspond to Visit1; white bars correspond to Visit2.
