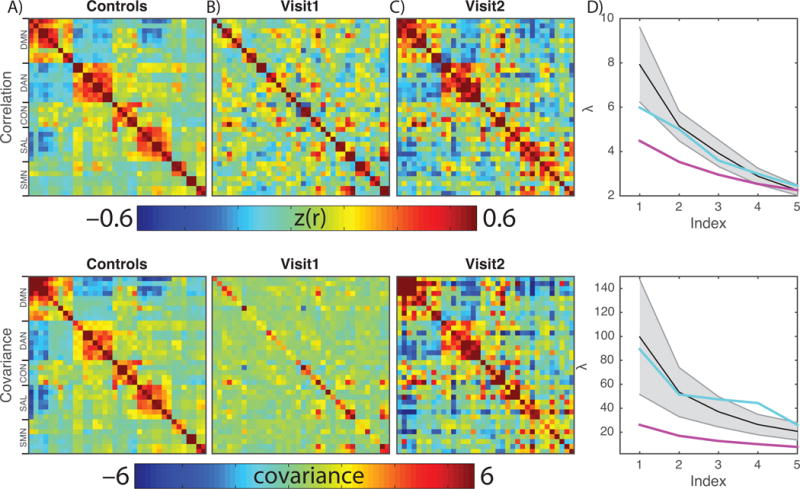
Figure 3.

BOLD organization and amplitude is disrupted in a patient with NMDAR encephalitis. Top row shows BOLD correlation matrices; the bottom row shows BOLD covariance matrices. The salient difference in these results is that the former is normalized with respect to signal amplitude. A: BOLD correlation and covariance matrices derived from 45 age-matched healthy individuals. Rows and columns index individual regions of interest; the color indicates the correlation/covariance value of the BOLD signal extracted from ROIs. The prominent blocks represent RSNs. B: RSN structure is absent at Visit1. The covariance matrix emphasizes that the signal is both disorganized and has low amplitude. C: RSN structure and amplitude is restored at Visit2. D: Quantification of this observation is achieved by comparing the five largest eigenvalues of the matrices in healthy individuals (black line, grey area is +/− 1SD), Visit1 (magenta) and Visit2 (teal). The Visit1 result is abnormally flattened while the Visit2 result is within the normal range.
