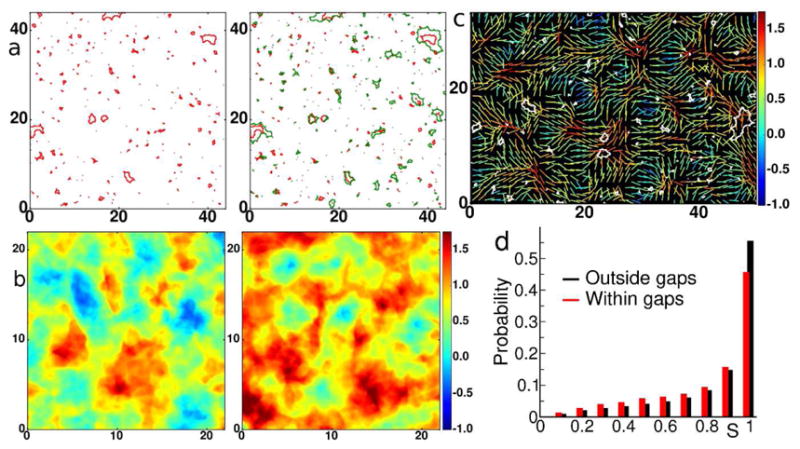
Figure 4. The model monolayer mimics endothelial gap formation.

a. Red contours are the gaps at the yielding transition corresponding to the point labeled Pm in Figure 3c. Green contours are gaps with further increase of strain corresponding to moving from Pm to P2 in the yield curve of Figure 3c. The further increase in permeability preferentially occurs via gap growth as evidenced by comparing the maps of inter-particle gaps at the onset of the yielding regime (left panel) and after (right panel). b. Maps of average normal stress (in units of [ ]) in the model monolayer corresponding to P1 (left panel) and Pm (right panel) indicate that the yielding regime is associated with pronounced spatial heterogeneities in inter-particle stress. c. Lines represent orientation of maximal principal stress vectors at P1 and the color indicates the value of the local normal stress (measured in units of [ ]). Superimposed are the gaps (white contours) measured at Pm. d. Probability distribution of the orientation order parameter S in areas which become disrupted by gaps at Pm(red), compared to the overall distribution at P1 (black), illustrating the tendency of large gaps to grow in disordered regions.
