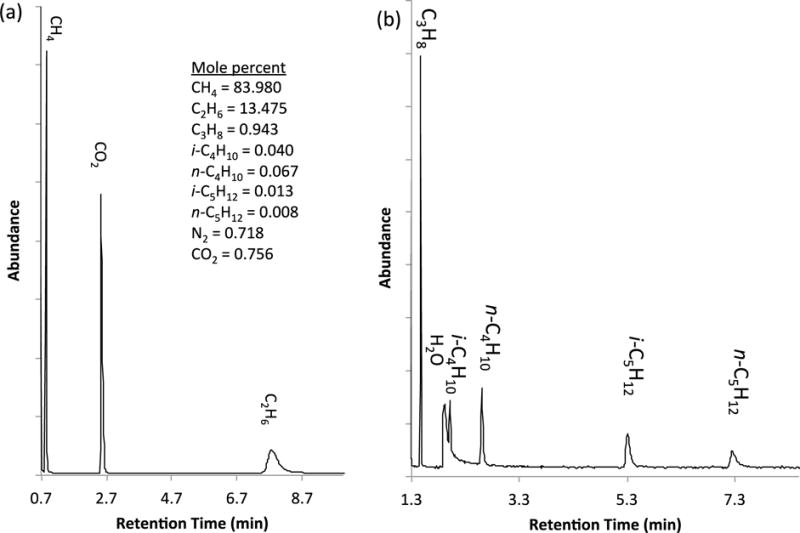
Figure 2.

GC-MS spectra of the analytes of a natural gas surrogate (mole percent as prepared gravimetrically, uncertainty is discussed in the text) after collection by the multi-PLOT-cryo method. The light compounds, spectrum (a), were analyzed using GC-MS with a porous polymer PLOT column and the heavier compounds, spectrum (b), were analyzed using GC-MS with a 5 % phenyl-95 %-dimethyl polysiloxane column.
