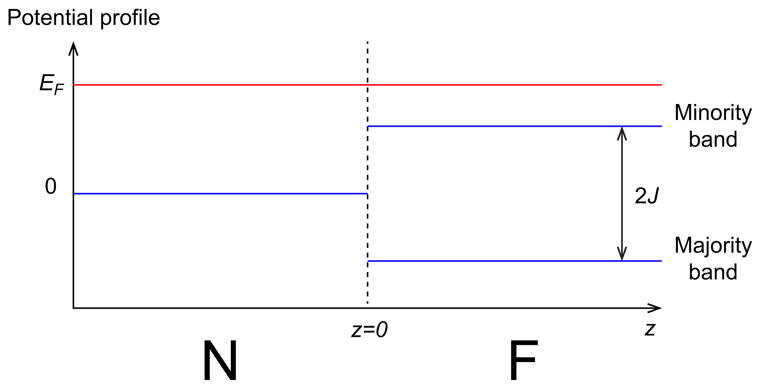
FIG. 3.
The potential profile (blue lines) for the model Eq. (17). The energy profile is spin-independent for z < 0 while it has a 2J gap between the majority and minority bands for z > 0. Here the red line denotes the Fermi level. The figure shows a typical situation where EF > J so that the spin polarization at the ferromagnet is incomplete, but the theory covers the whole range of positive EF.

