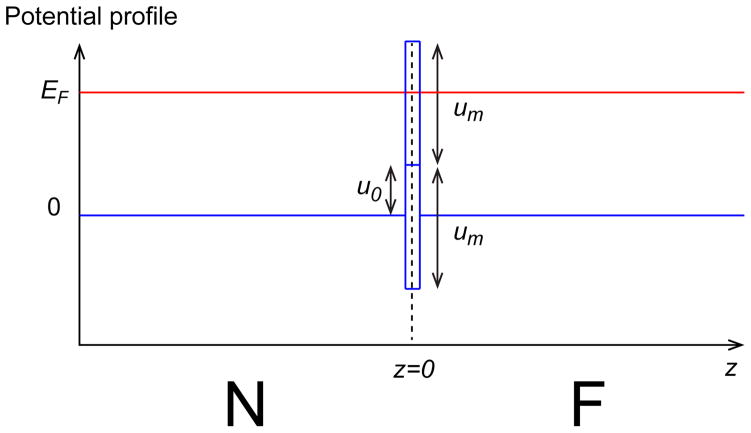
FIG. 5.
The potential profile (blue lines) for the model Eq. (22). Here the spin-independent potential u0 and spin-dependent potential um are present at z = 0. The red line denotes the Fermi level. In this figure, a delta functions is represented as a square function with a finite height and a finite width for illustration.

