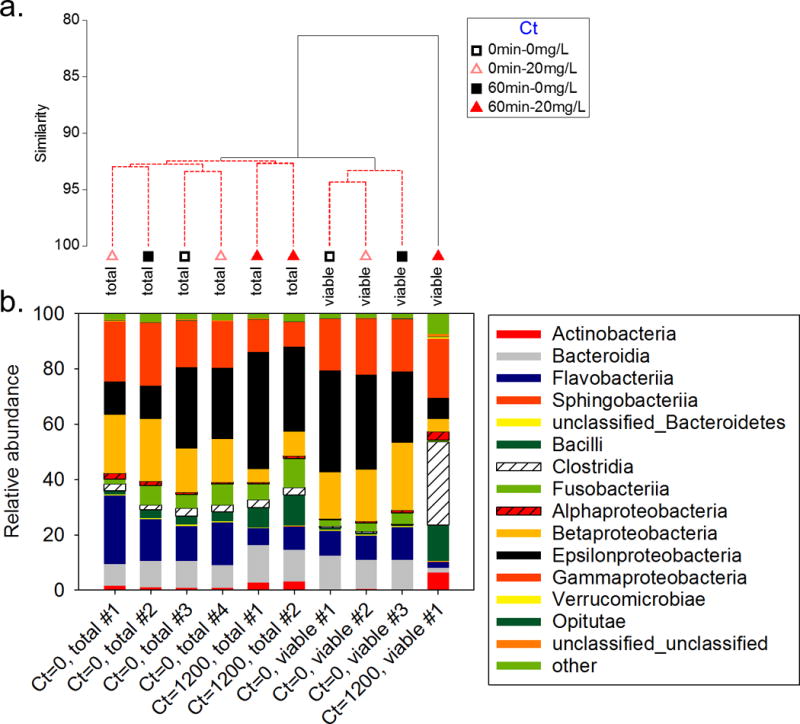
Fig. 3.

(a) Cluster analysis and (b) relative abundance of Bacterial phyla for different PAA treatments and exposure times (Ct values in mg·min/mL). Samples connected by red bars on the cluster tree do not have significantly different structures. #’s represent replicate samples that were sequenced.
