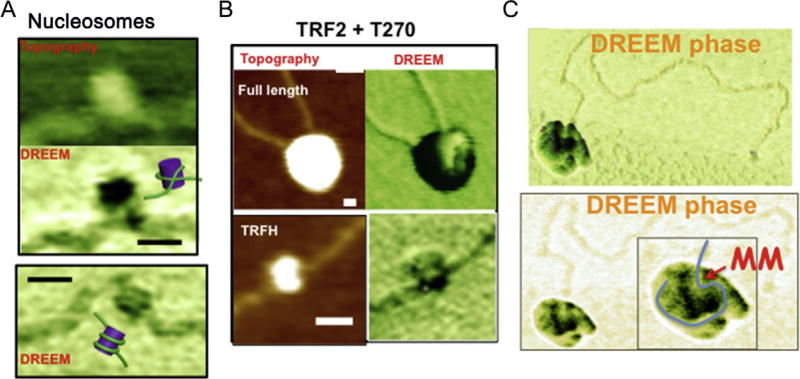
Fig. 3.
DREEM imaging of protein–DNA complexes. (A) DREEM phase image reveals DNA wrapping around histone proteins in nucleosomes reconstituted in vitro on DNA containing the 601 nucleosomal positioning sequences. (B) DREEM phase image of TRF2 on DNA containing 270 TTAGGG repeats (T270) reveals portions of folded DNA appearing at the edge (lighter regions) of large multimeric full-length TRF2 complexes (top) and wrapping around a subdomain of TRF2 (TRFH). Scale bars: 20 nm. (C) DREEM phase (top: surface plot; bottom: top view) images of a large MutSα–MutLα–DNA complex containing ~10 proteins on a linear DNA substrate containing a mismatch (MM).

