Figure 6.

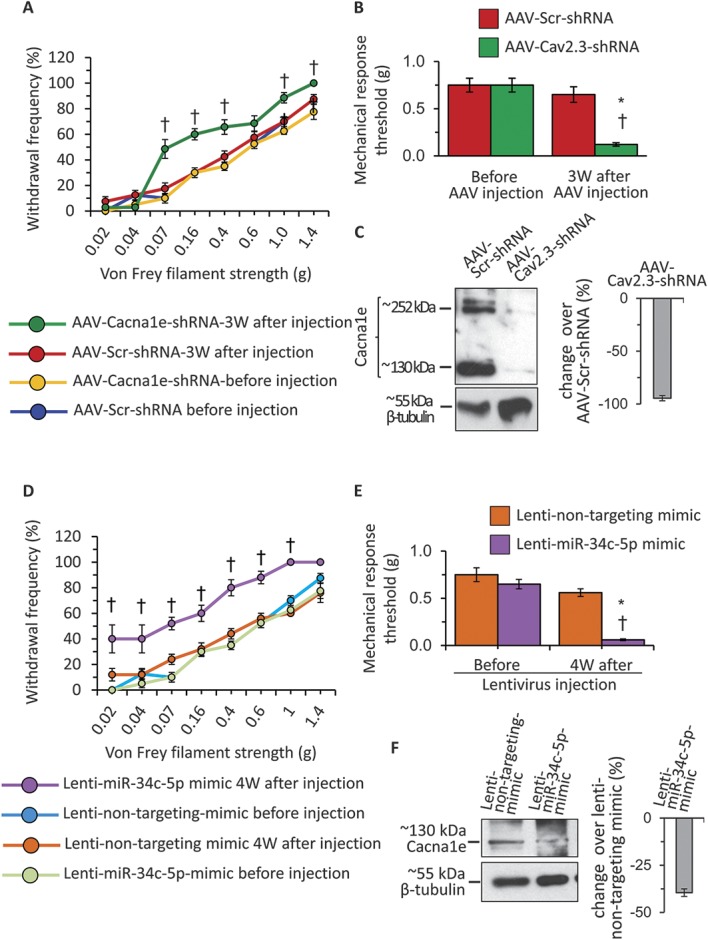
Analyses of functional contribution of Cav2.3 and miR-34c-5p in the mediation of mechanical sensitivity in wild-type mice. (A) Change in the frequency of paw withdrawal to the plantar application of graded von Frey filament forces of different strength in ipsilateral paws following intraganglionic injection of AAVs carrying either scrambled shRNA (AAV-Scr-shRNA) or shRNA directed against coding sequence of Cav2.3 (AAV-Cav2.3-shRNA), measured before and at 3W after viral injections. (B) Mechanical response thresholds calculated as von Frey filament strength required to achieve 60% withdrawal frequency in ipsilateral paws following intraganglionic injection of AAV-Scr-shRNA or AAV-Cav2.3-shRNA, measured before and at 3W following viral injection. (C) Representative western blot analysis images and their quantification for Cacna1e or β-tubulin protein expression in the DRG tissue lysates following intraganglionic injection of AAV-Scr-shRNA or AAV-Cav2.3-shRNA. (D) Change in the frequency of paw withdrawal to the plantar application of graded von Frey filament forces of different strength in ipsilateral paws following intraganglionic injection of lentivirus carrying either nontargeting miRNA mimic (Lenti-nontargeting-mimic) miR-34c-5p specific mimic (Lenti-miR-34c-mimic), measured before and at 4W after viral injections. (E) Mechanical response thresholds calculated as von Frey filament strength required to achieve 60% withdrawal frequency in ipsilateral paws following intraganglionic injection of Lenti-nontargeting-mimic or Lenti-miR-34c-mimic, measured before and at 3W following viral injection. (F) Representative western blot analysis images and their quantification for Cacna1e or β-tubulin protein expression in the DRG tissue lysates following intraganglionic injection of Lenti-nontargeting-mimic or Lenti-miR-34c-mimic. In panels A, B, D, and E, *P ≤ 0.05 as compared to basal readings and †denotes P ≤ 0.05 as compared to a corresponding data point in other 3 groups, 2-way analysis of variance of repeated measures followed by Bonferroni multiple comparisons post hoc test, n = 8 mice per group. In panels C and F, *P ≤ 0.05 as compared to control group, analysis of variance followed by post hoc Fischer test, n = 5 independent experiments.
