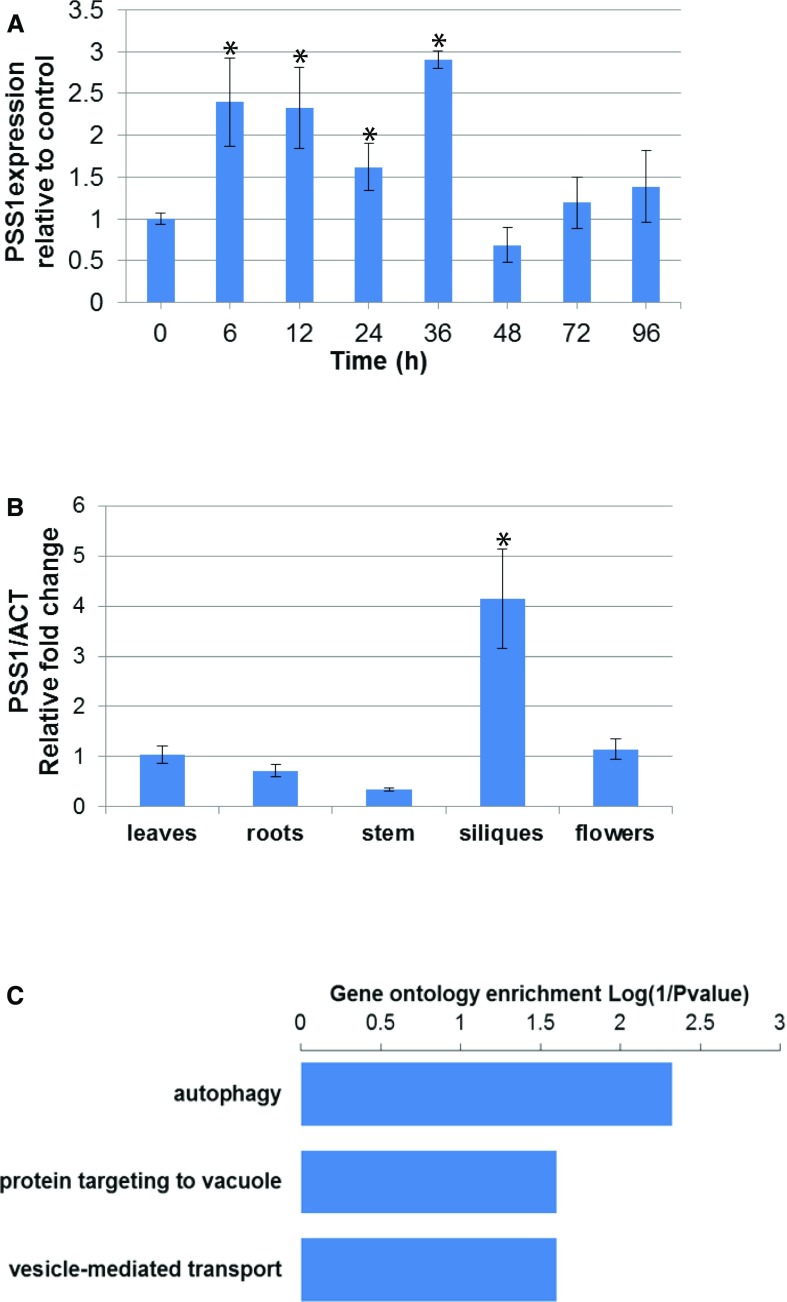
Figure 5.
Expression of PSS1 and genes that show expression patterns similar to PSS1. A, Expression of PSS1 following P. sojae infection. qRT-PCR of PSS1 was conducted following inoculation of Arabidopsis leaves with P. sojae in three independent experiments. The fold change values are relative to the mock control. PSS1 expression levels with asterisks were significantly induced (P < 0.05) when compared with the 0-h control. B, Expression patterns of PSS1 among various Arabidopsis tissues. qRT-PCR expression data of PSS1 were collected among Arabidopsis organs in three independent experiments. Expression comparison was against the levels in leaves (P < 0.05). Data in A and B are from three biological replications, and data were standardized against the transcript levels of the Actin gene. C, Gene Ontology enrichment (biological process) of PSS1 coexpression genes. The coexpression gene analysis was based on the mRNAseq data set using the software Genevestigator (Hruz et al., 2008).

