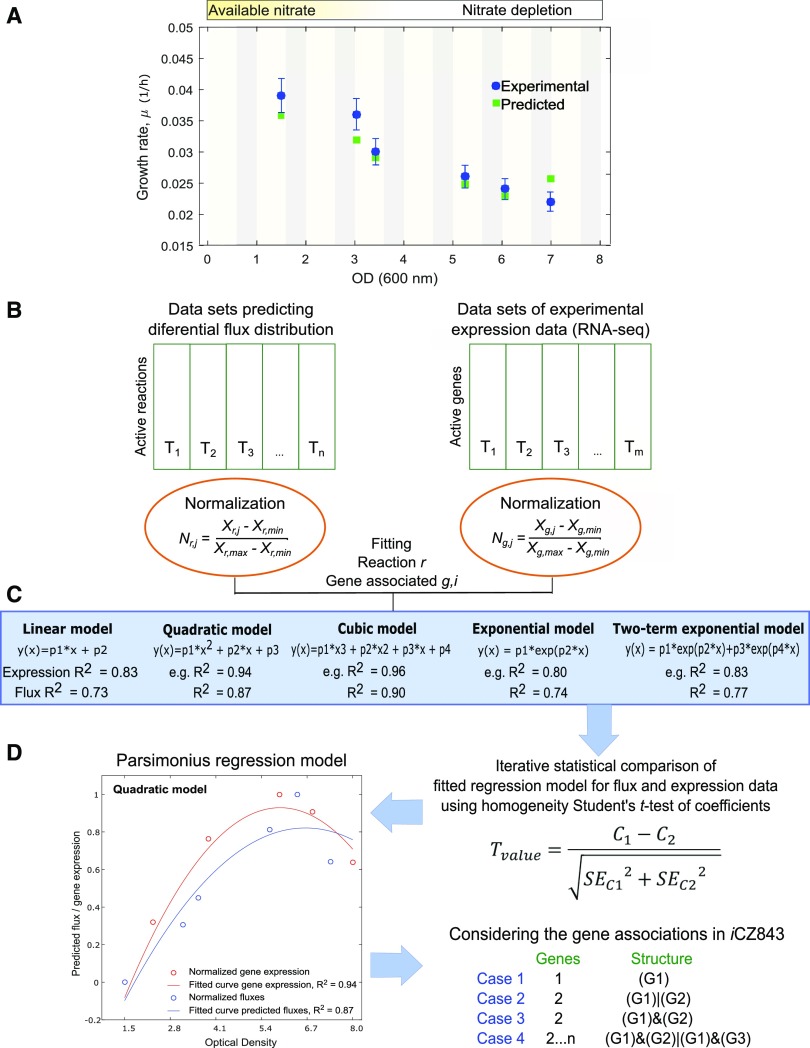
Figure 1.
Overview and workflow diagram of data analysis. A, Experimental and predicted growth rates under photoautotrophic growth. B, Flux distributions and gene expression data sets were independently normalized. Nr,j represents the flux distribution normalized value of reaction r at j time point. Ng,j is the normalized value for the g gene at time j. The normalized values ranged between zero and one in each data set. C, Iteratively fitted regression models (linear, quadratic, cubic, exponential, and two-term exponential regression model). D, Statistically identical models were extracted using a homogeneity test of coefficients to define the agreement between the predicted flux and expression data. C1 and C2 correspond to the two coefficients being compared, and SEC1 and SEC2 to the se of coefficients calculated by least-squares fitting method. The number of fitted coefficients depends of the regression model (i.e. linear has two fitted coefficients [p1 and p2] and two-term exponential model has four). G1..n represents the number of genes associated with specific reaction.

