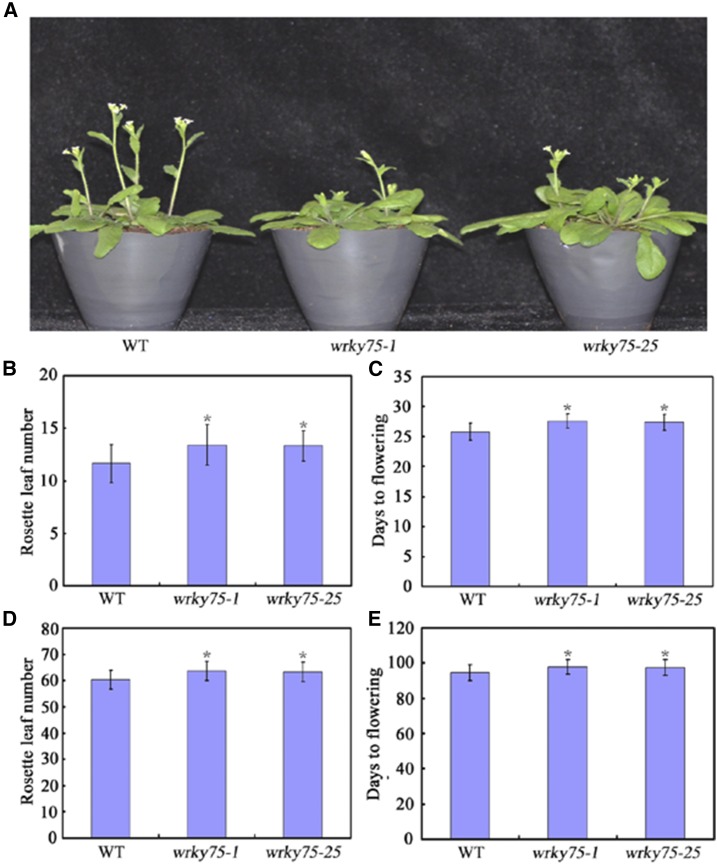
Figure 1.
Flowering phenotype of wrky75 mutant plants. A, Representative images of wrky75 mutant plants showing their flowering phenotype under LD conditions. Three independent experiments were performed with each replica containing more than 30 plants for each line. Representative plants were photographed. B and C, Flowering phenotype of wrky75 mutant plants assessed by RLN (B) and DTF (C) under LD conditions. D and E, Flowering phenotype of wrky75 mutant plants assessed by RLN (D) and DTF (E) under SD conditions. For (B) to (E), values are mean ± sd of approximately 30 plants (*P < 0.05). Asterisks indicate Student’s t-test significant differences. The experiments were repeated at least three times with similar results.

