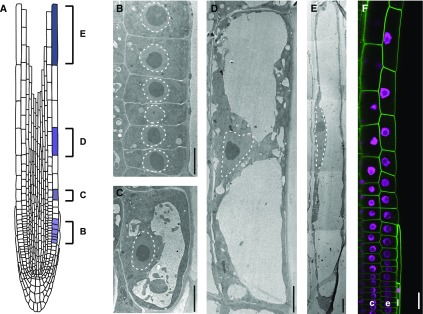
Figure 1.
Inner polar nuclear positioning during cell elongation of root trichoblasts. A, Schematic root structure. Cells highlighted in blue correspond to the cells shown in B to E. B to E, TEM images of root epidermal trichoblasts. B, Trichoblasts in the meristematic zone. C to E, Trichoblasts in the elongation zone. Dotted lines show outlines of the nuclei. Bars = 10 µm. F, Live image showing part of a lateral root cap layer (l), a root epidermal trichoblast cell file (e), and a cortical cell file (c). Nuclei, H2B-mCherry (magenta); PM, EGFP-LTI6a (green). Bar = 20 µm.

