Figure 2.
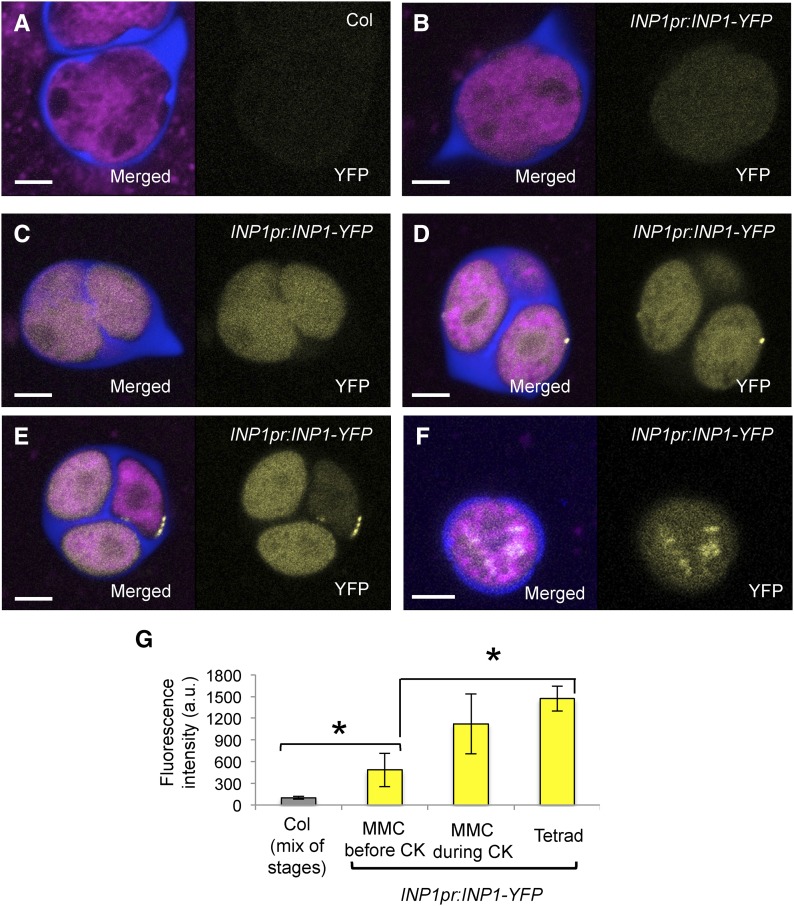
Diffuse INP1-YFP fluorescence first appears in MMC, but puncta do not form until the tetrad stage. A to F, Confocal images of MMCs and tetrads. In each, image on the right shows YFP fluorescence and image on the left is the merged fluorescent signal from YFP (yellow), Calcofluor White (blue, CW), and CellMask Deep Red (magenta, membranous structures). A, Control Col-0 sporogenic cells exhibit essentially no background yellow fluorescence (MMC prior to cytokinesis is shown). B to F, Cytoplasmic and punctate YFP fluorescence in INP1pr:INP1-YFP sporogenic cells at different stages of development. B, MMC prior to cytokinesis. C, MMC during cytokinesis. D, Tetrad with some puncta. E, Tetrad with punctate lines forming. Note that the microspore with the INP1 line has the reduced amount of cytoplasmic YFP fluorescence compared to its sisters in which puncta have not yet formed. F, A young free microspore with cytoplasmic dots of YFP fluorescence. Scale bars = 5 μm. G, Quantification of mean diffused YFP fluorescence in control Col-0 sporogenic cells (Col, different developmental stages) and INP1pr:INP1-YFP in MMC before and during cytokinesis and at the tetrad stage (a.u., arbitrary units). Error bars indicate SD. Asterisks indicate statistical significance (P < 0.05).

