Figure 4.
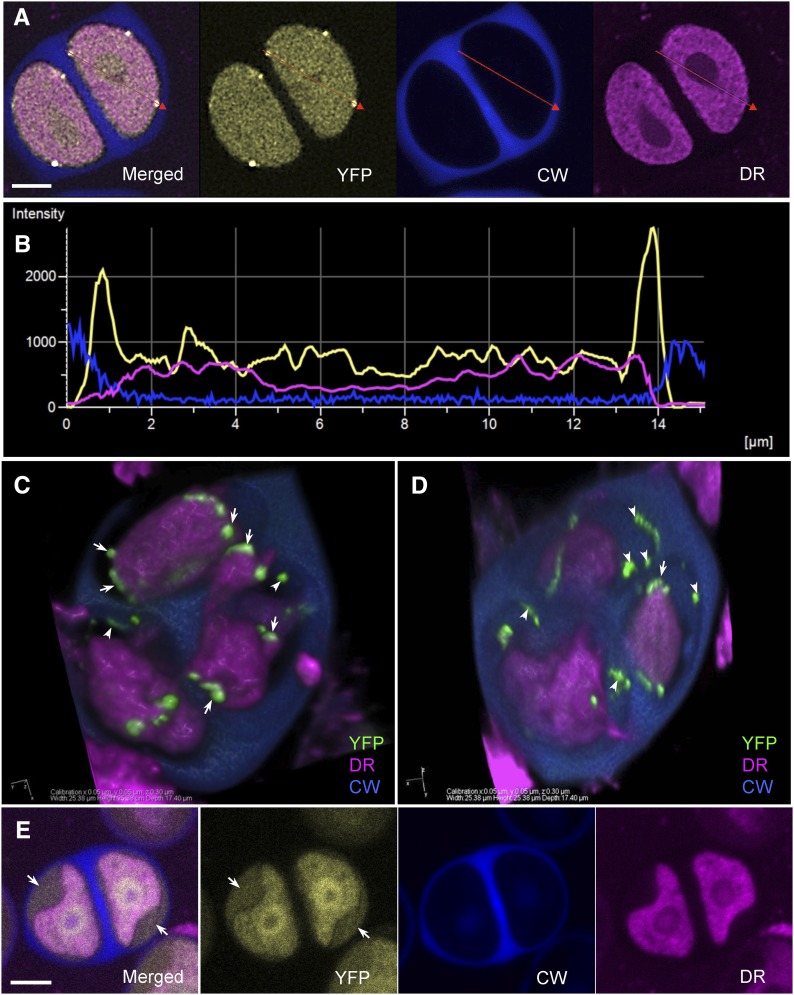
INP1-YFP puncta and lines form between plasma membrane and CW. A, Confocal images of tetrad-stage microspores showing YFP (yellow), Calcofluor White (CW, blue), and CellMask Deep Red (DR, magenta) fluorescence. A red line is drawn through two INP1 puncta. B, Signal intensity profile of the three fluorophores along the red line shown in A. Yellow peaks coincide with the drop in magenta fluorescence and are followed by the increase in blue fluorescence. C to D, A 3D reconstruction of a plasmolyzed DMC1pr: INP1-YFP tetrad. Two different views of the same tetrad are shown. INP1-YFP puncta (green) are visible in association with both plasma membrane (arrows) and CWs (arrowheads). CW is partially removed to reveal the microspores. E, In microspores in which membranes got separated from the CW, the diffused INP1-YFP signal appears to occupy the space between the surface of plasma membranes and the CWs (arrows). Fluorophore colors as the same as in A. Scale bars in A and E = 5 μm.

