Figure 5.
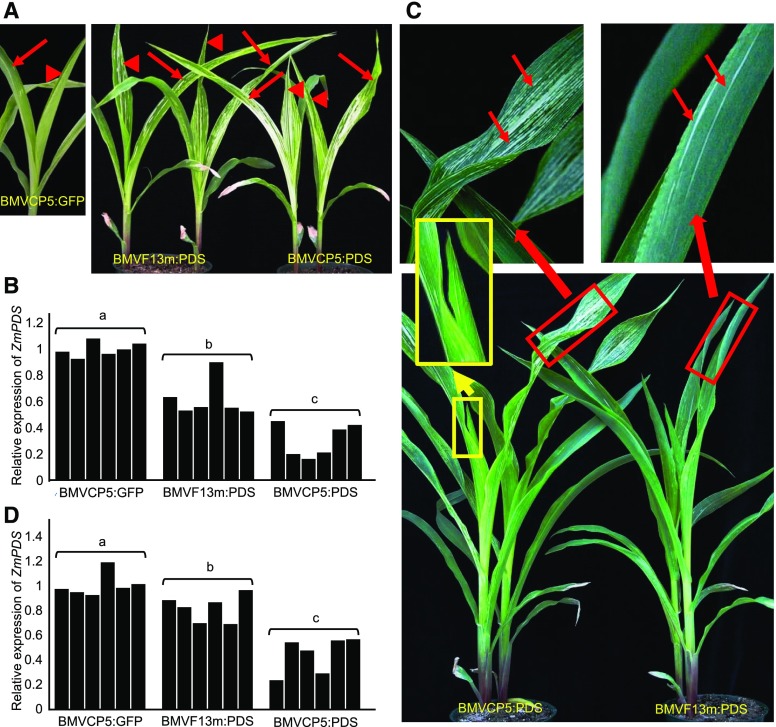
Silencing the PDS gene in maize using BMVF13m:PDS or BMVCP5:PDS. Similar amounts of BMVCP5:GFP, BMVF13m:PDS, or BMVCP5:PDS virion were inoculated to maize seedlings. A, Systemically infected leaves above the inoculated leaves from BMVCP5:GFP-inoculated plants (left image) or BMVF13m:PDS- or BMVCP5:PDS-inoculated plants (right image) were photographed at 12 dpi. Arrows indicate the second systemically infected leaves, and arrowheads indicate the third systemically infected leaves. Similar visual phenotypes were observed in two additional experiments. B, Relative expression levels of ZmPDS transcript in maize plants inoculated with BMVCP5:GFP, BMVF13m:PDS, or BMVCP5:PDS were determined through qRT-PCR of extracts from the second and third systemically infected leaves harvested 2 weeks post inoculation. The expression of the maize EF-1A gene in these plants was analyzed and used to normalize ZmPDS expression levels across treatments. Each bar represents expression from an individual plant. C, Maize plants inoculated with BMVF13m:PDS or BMVCP5:PDS virion were photographed at 30 dpi (bottom image). Images at top are magnifications of the blades from the fourth systemically infected leaves shown in the image below (red rectangular boxes). Photobleaching streaks are indicated with arrows. Images in yellow rectangular boxes indicate unmagnified and magnified images of the emerging sixth systemically infected leaf with photobleaching streaks. D, Relative expression levels of ZmPDS in maize plants inoculated with BMVCP5:GFP, BMVF13m:PDS, or BMVCP5:PDS were determined through qRT-PCR of extracts from the fourth and fifth systemically infected leaves harvested at 30 dpi. The qRT-PCR assay was done as described in B. For B and D, different letters above each treatment group indicate significant differences in values between those treatments at the 0.05 significance level as determined by ANOVA and lsd test.

