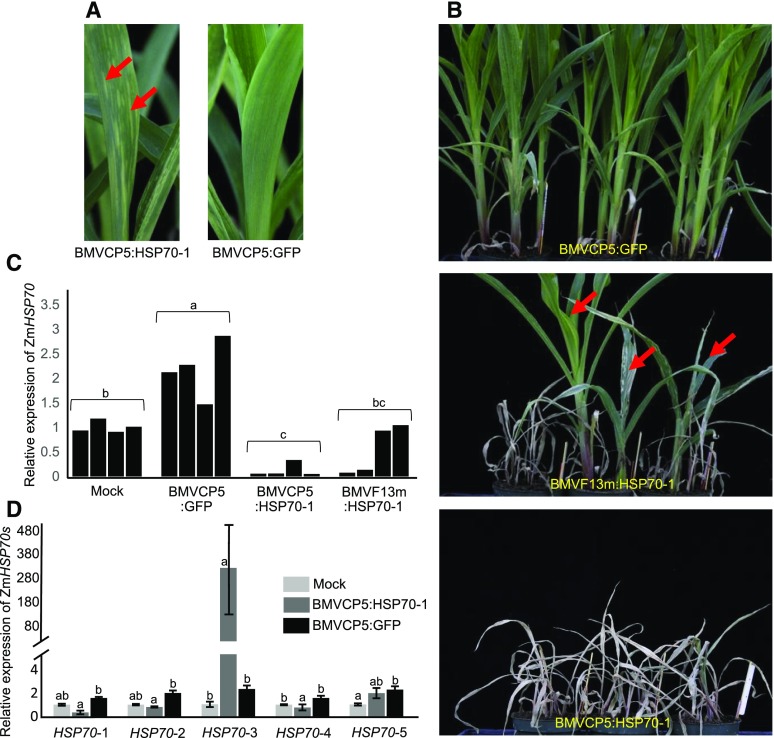
Figure 6.
A more extensive necrosis phenotype is correlated with greater target transcript silencing in maize infected with BMVCP5:HSP70-1. Similar amounts of BMVCP5:GFP, BMVF13m:HSP70-1, or BMVCP5:HSP70-1 virion were inoculated to maize seedlings. A, Systemically infected leaves from maize plants inoculated with BMVCP5:HSP70-1 (left) or BMVCP5:GFP (right) were photographed 2 weeks post inoculation. Arrows indicate pale green streaks in the BMVCP5:HSP70-1-infected leaf. B, Chlorotic streaks continued to expand and eventually changed to necrosis, resulting in leaf death for many plants infected with BMVF13m:HSP70-1 and all plants infected with BMVCP5:HSP70-1 at 1 month post virus inoculation. Three plants inoculated with BMVF13m:HSP70-1 (arrows) showed necrosis and severe stunting but did not die. C, Relative expression levels of ZmHSP70-1 transcript in the mock-inoculated (Mock), BMVCP5:GFP-, BMVCP5:HSP70-1-, or BMVF13m:HSP70-1-inoculated maize plants were determined through qRT-PCR of extracts from second and third systemically infected leaves harvested at 18 dpi. Maize EF-1A transcript levels in these plants were determined and used to normalize ZmHSP70-1 expression levels across treatments. Each bar represents expression from a single plant. Different letters above each treatment group indicate significant differences in mean values between those treatments at the 0.05 significance level determined by ANOVA followed by lsd test. The experiment was repeated twice with identical findings. D, Analysis of transcript levels of five different ZmHSP70s in plants silenced for HSP70-1 at 18 dpi. Primers used for qRT-PCR are listed in Supplemental Table S1. The expression of maize EF-1A in these samples was used to normalize HSP70 expression levels across treatments for each HSP70 family member. Each bar and error bracket represents the mean value ± sd for results from three plants. Different letters above each treatment group indicate significant differences in values between those treatments at the 0.05 significance level determined by ANOVA followed by lsd test. The experiment was repeated with similar results.

