Figure 3.
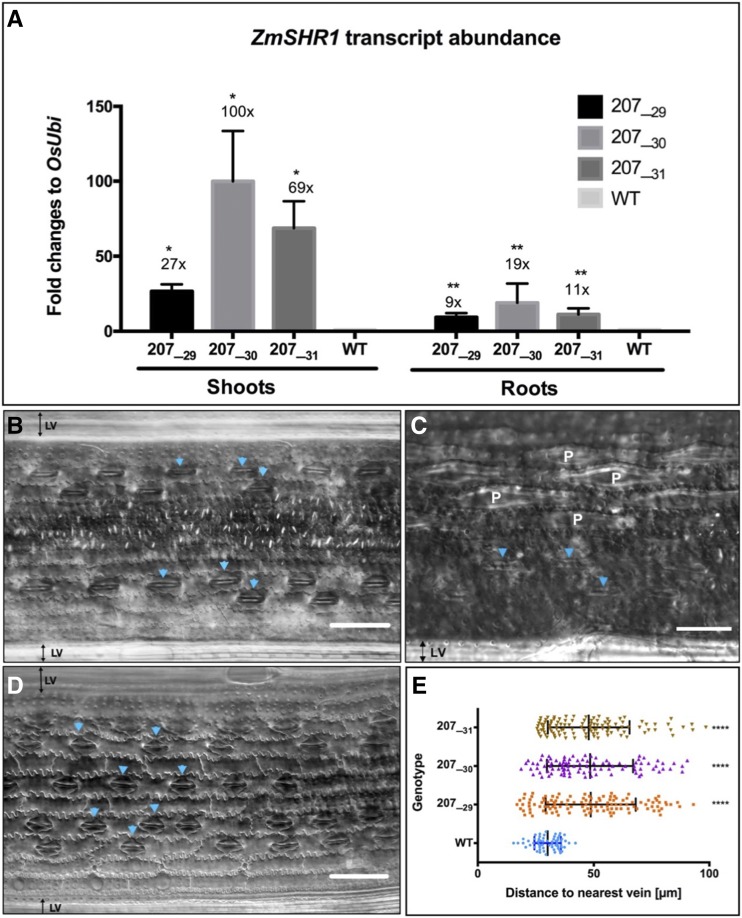
Ectopic ZmSHR1 expression perturbs stomatal patterning in rice. A, Bar charts representing ZmSHR1 transcript abundance in shoots and roots of wild-type (WT) cv Kitaake plus three T2 transgenic lines (207_29H, 207_30K, and 207_31J). Expression was quantified by quantitative reverse transcription-PCR. Transcript levels were normalized to endogenous rice ubiquitin (OsUbi) transcripts and are presented as fold changes above background (wild-type levels are set to 1). Values represent means of two biological replicates, and error bars represent se. *, P < 0.02 and **, P < 0.004 as determined by a two-tailed Student’s t test. B to D, Paradermal views of the abaxial epidermis of cleared wild-type (B) and ZjPCKpro:ZmSHR1 (D) leaves visualized by DIC microscopy. A magnified view (C) illustrates papillae cells (denoted as P) in the wild type. Arrowheads point to stomata. LV, Lateral vein. Bars = 50 µm (B and D) and 75 µm (C). E, Box plot representing measured distances between stomata and the nearest vein in leaves of the wild type and three ZjPCKpro:ZmSHR1 T2 lines. Each data point represents a single stomatal complex. P values were determined by one-way ANOVA where transgenics were individually compared with the wild type: ****, P = 0.0001.

