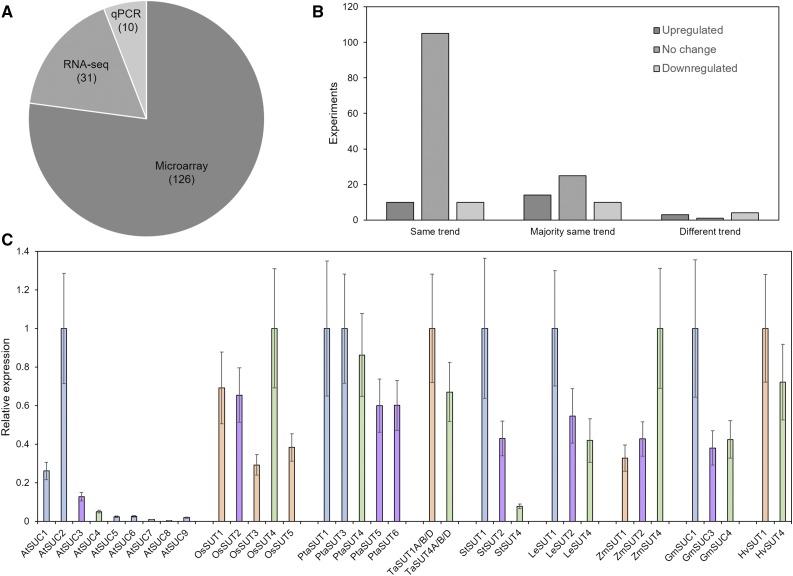
Figure 2.
Sources and consistency of gene expression data used in this study. A, Percentages of the different techniques, that is microarray, RNAseq, and quantitative PCR, that were used to generate the 167 data sets used in this study. B, Consistency of the trend of biological replicates. C, Relative Suc transporter expression levels in mature leaves under control conditions according to all experiments considered in this study. Data were normalized to the highest expressing SUT for each species. Error bars indicate sd. The minimum number of biological replicates for each expression value in C was n = 38. Bar color indicates the type of Suc transporter (blue = type I, purple = type IIA, orange = type IIB, green = type III).

