Figure 4.
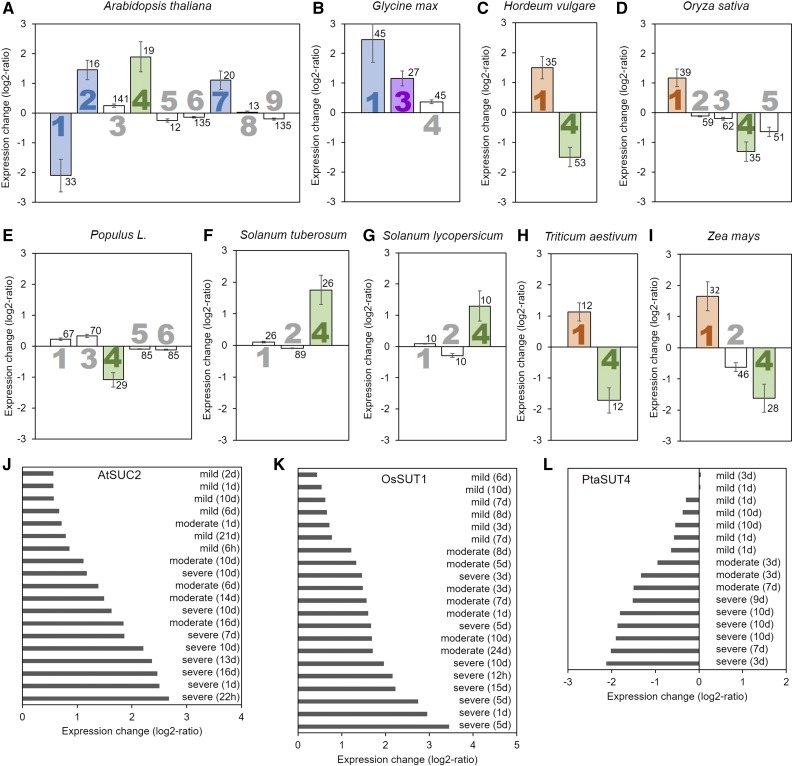
Influence of drought stress on Suc transporter expression. The average log2-fold change in expression compared to control conditions for the different Suc transporters (large numbers) is presented for Arabidopsis (A), soybean (B), barley (C), rice (D), poplar (E), potato (F), tomato (G), wheat (H), and maize (I). Perturbation plots of Arabidopsis AtSUC2 (J), rice OsSUT1 (K), and poplar PtaSUT4 (L). Significant changes are highlighted by filled bars with color indicating the type of Suc transporter (blue = type I, purple = type IIA, orange = type IIB, green = type III). Error bars represent sd. Small numbers indicate number of biological replicates.

