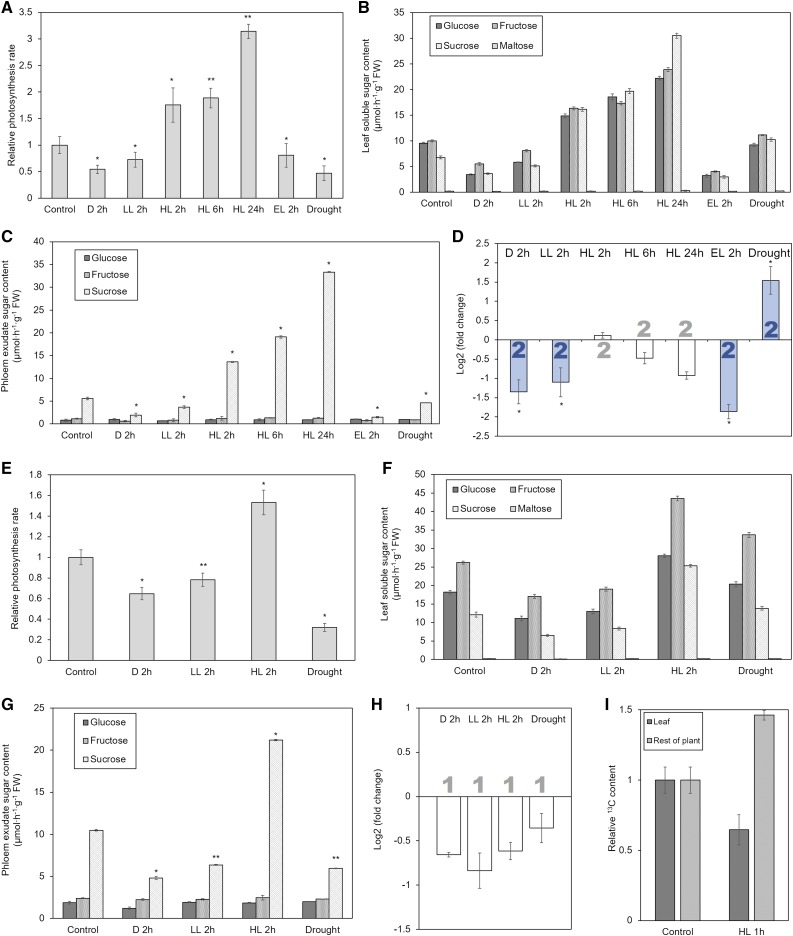
Figure 6.
Comparison of photosynthesis rate, sugar content in leaf extract, sugar content in phloem exudate, carbon export, and Suc transporter gene expression in Arabidopsis (A–D) and tomato (E–I). All parameters were measured at the same time on comparable leaves of the same plants, except for the measurement of carbon export (I). This was performed on plants at the same growth stage as those for the other experiments by applying a pulse of 13CO2 to a source leaf, transfer to experimental conditions for 1 h, and determination of the 13C content of the leaf and the rest of the plant. Significance of differences to control values is indicated by *P < 0.05 and **P < 0.01. Error bars indicate sd. Significant changes of gene expression are highlighted by filled bars with color indicating the type of Suc transporter (blue = type I). Average values were obtained from at least three biological replicates. Abbreviations: D, dark; LL, low light; HL, high light.

