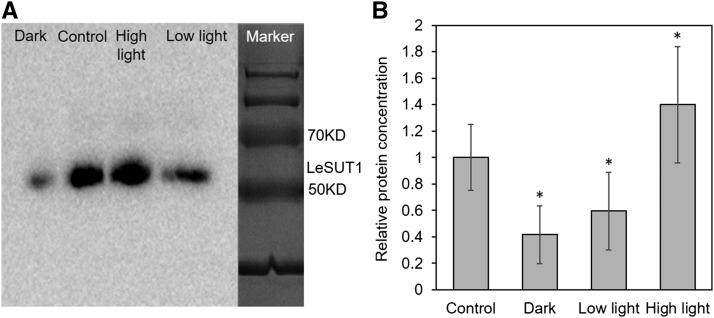
Figure 8.
Protein abundance of tomato LeSUT1 in response to different light levels. A, Representative western blot showing the LeSUT1-specific band at 56 kD. B, Average intensity of LeSUT1-specific bands measured in four experiments. Plant material was the same as used for qPCR (Fig. 6F). Significance of differences to control values is indicated by *P < 0.05.

