Figure 3.
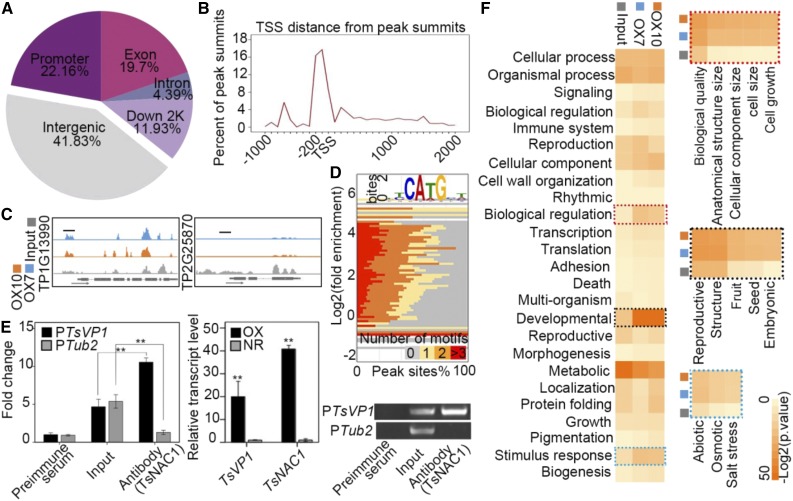
ChIP-Seq assay of TsNAC1. A, Distribution of TsNAC1 transcription factor-binding sites. B, Identified peak distance from transcription start sites (TSS) for TsNAC1. The peaks were highly enriched from −200 to +100 bp to the transcription start sites. C, ChIP-Seq signals of TP1G13990 (TsVP1) and TP2G25870 (Tub2) on the genome browser. The tag counts were normalized in each bin according to the total number of reads. Short black lines mark regions used for the ChIP-quantitative PCR (qPCR) assay. D, Binding situation of TsNAC1 quantified by the percentage occurrence of the CA(T/A)G motif (x axis) plotted against the log2 fold enrichment of immunoprecipitation samples compared with the input sample (y axis), with the color of each square mapped to the number of indicated peak motifs. E, Anti-TsNAC1 ChIP-qPCR validation and transcript detection of TsVP1 and TsNAC1. Samples immunized by preimmune serum were used as the negative control in the ChIP-qPCR assay. Bars represent means ± sd, with three biological replicates in the experiment and five plants for each repeat. Significant differences by Student’s t test are indicated with asterisks: **, P < 0.01. F, GO analysis results of the input sample data and data for two immunoprecipitation samples (OX7 and OX10). The dotted rectangles indicate significant and consistent GO enrichment and the hierarchical classification results of biological regulation, developmental processes, and responses to stimuli.

