Figure 6.
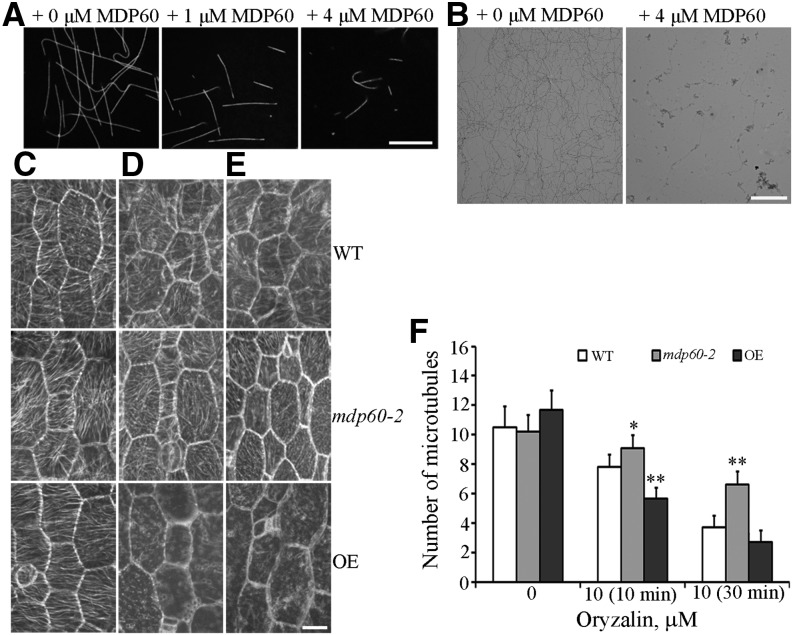
MDP60 is a microtubule destabilizer. A, Fluorescent images of microtubules polymerized in 20 μm rhodamine-labeled tubulin solution in the presence of 0, 1, and 4 μm MDP60. Bar in A = 10 μm. B, Negative stain electron micrographs of A. Bar in B = 5 μm Cortical microtubules were observed in epidermal cells in the middle regions of hypocotyls from light-grown wild-type (WT), mdp60-2, and MDP60-overexpressing (OE) seedlings after treatment with 0 μm oryzalin (C), 10 μm oryzalin for 10 min (D), and 10 μm oryzalin for 30 min (E). Bar in E = 10 μm. F, Quantification of cortical microtubules in hypocotyl epidermal cells of wild-type, mdp60-2, and OE seedlings using ImageJ software (n > 30 cells for each sample). The y axis represents the number of cortical microtubules that crossed a fixed line (∼10 μm) perpendicular to the orientation of the majority of cortical microtubules in the cell. *P < 0.05, **P < 0.01, t test. Error bars represent mean ± sd.

