Figure 1.
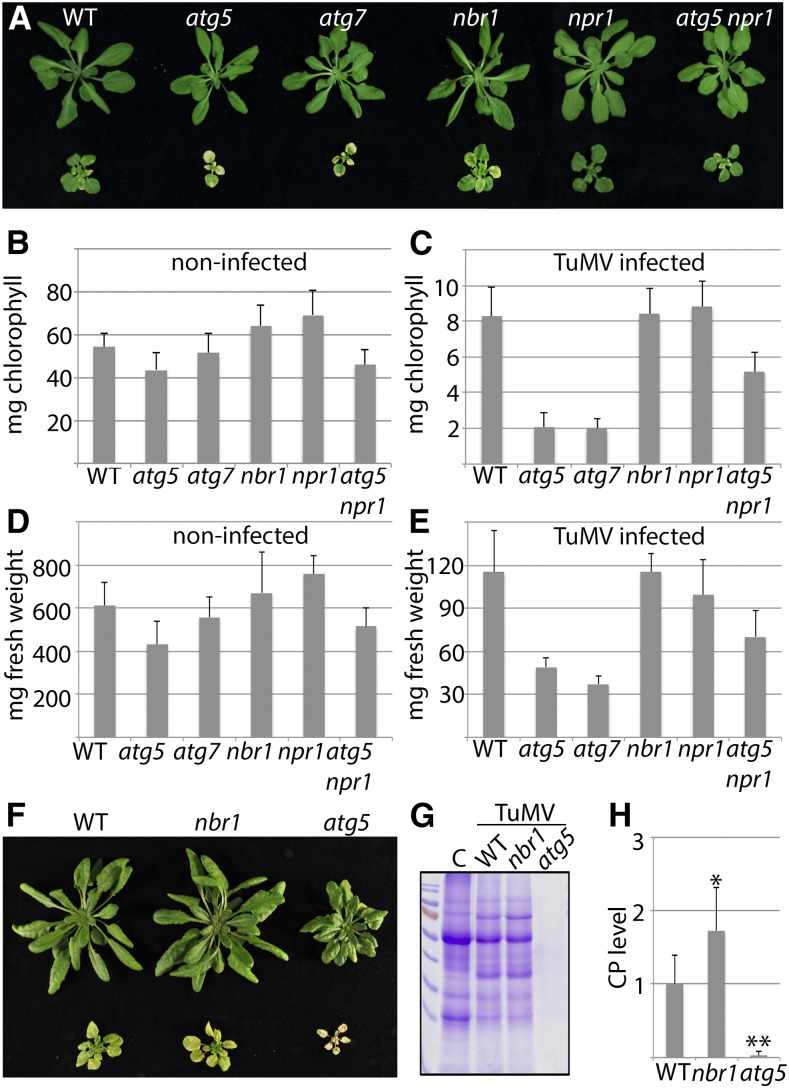
Autophagy promotes plant fitness during TuMV infection. A, Virus-induced symptoms in wild-type, atg5, atg7, nbr1, npr1, and atg5 npr1 plants at 21 DAI with TuMV (bottom) compared to noninfected controls (top). B and C, Total chlorophyll content of infected (B) and noninfected (C) plants at 21 DAI (n = 8 individual plants). D and E, Fresh weight of infected (D) and noninfected (E) plants at 21 DAI (n = 8 individual plants). F, Virus-induced symptoms in wild-type, nbr1, and atg5 plants at 28 DAI (bottom) compared to noninfected controls (top). G, Total protein analysis by SDS-PAGE and Coomassie Brilliant Blue staining in TuMV-infected wild-type, nbr1, and atg5 plants at 28 DAI compared to noninfected wild-type control (C). H, Direct ELISA detecting viral CP levels in wild-type, nbr1, and atg5 at 28 DAI (n = 6 individual plants). All values represent means ± sd. Statistical significance (*P < 0.05; **P < 0.01) was revealed by student’s t test (compared with wild type).

