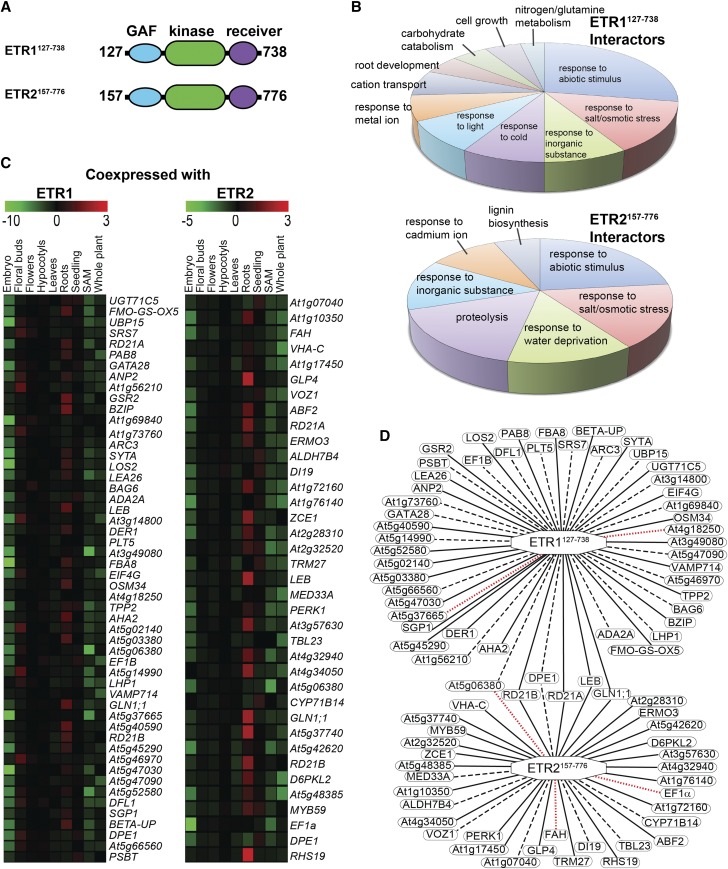
Figure 8.
Yeast two-hybrid screen using the cytosolic domains of ETR1 and ETR2 reveals putative overlapping and nonoverlapping interaction partners. A yeast two-hybrid screen was carried out using the cytosolic portion of ETR1 (ETR1127-738) or ETR2 (ETR2157-776) as described in the “Materials and Methods”. A, Diagram of cytosolic portions of ETR1 and ETR2 used for yeast two-hybrid screen. Numbers represent the amino acids included in these constructs. B, GO categorization of proteins identified in this screen as interacting with ETR1127-738 or ETR2157-776. GO enrichment analysis was carried out using DAVID (https://david.ncifcrf.gov/). Only GO categories with a false discovery rate value < 0.05 were included. C, Heatmap showing coexpression patterns for ETR1 and ETR2 interacting proteins. Red indicates the protein has highly correlated gene coexpression with the receptor and green represents highly anticorrelated coexpression. D, Gene coexpression map of the ETR1 and ETR2 interacting partners. Solid edges represent proteins with significantly correlated expression profiles with the receptor in roots. Dashed edges represent proteins with significantly correlated coexpression profiles in at least one tissue, but not roots. Dotted red edges represent no significant correlation in the coexpression profile between the receptor and the gene in question.

