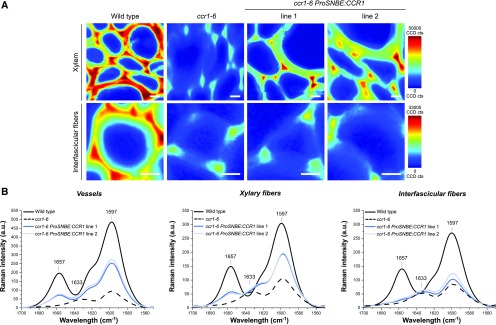
Figure 5.
Raman microscopy analysis of cell walls of wild-type, ccr1-6, and ccr1-6 ProSNBE:CCR1 plants. A, Examples of Raman mapping images taken from the xylem and interfascicular fiber region of the wild type, ccr1-6, and ccr1-6 ProSNBE:CCR1 lines by integrating the aromatic stretching vibration from 1,650 to 1,550 cm−1. CCD cts, Charged Coupled Device counts. Bars = 10 µm. B, Extracted average spectra in the lignin aromatic region between 1,700 and 1,550 cm−1 obtained by a region-of-interest study in vessels, xylary fibers, and interfascicular fibers (n = 18: 3 biological replicates × 2 mappings × 3 regions of interest). The marked bands represent 1,657 cm−1 (C=C stretching of coniferyl alcohol plus C=O stretching of coniferaldehyde), 1,633 cm−1 (C=C stretching from the propenoic acid side chain of ferulic acid), and 1,597 cm−1 (aromatic ring stretching of lignin). a.u., arbitrary units.

