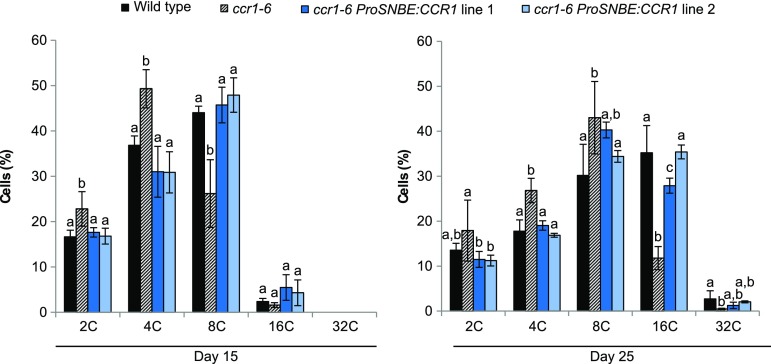
Figure 9.
Nuclear ploidy levels of wild-type, ccr1-6, and ccr1-6 ProSNBE:CCR1 cells. Flow cytometry analysis is shown for the first leaves at 15 and 25 d post stratification (15 d, n = 4; 25 d, n = 5). Error bars indicate sd. Different letters represent significant differences at the 0.05 significance level (Dunnett-Hsu adjusted Student’s t test).

