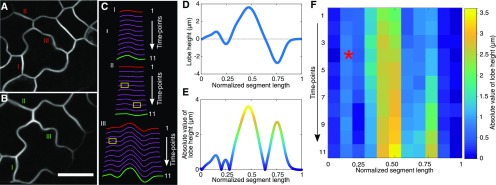
Figure 4.
Development of a method to quantify the timing and location of lobe initiation in pavement cell segments that span three-way cell junctions. A and B, Live-cell images of the cell boundaries at time points 1 and 11, respectively. The total elapsed time between these two images is 9.8 h. Bar = 20 µm. C, Segmented cell boundaries illustrating different types of wall reshaping that occur in developing cells. Yellow boxes label the time points and locations of new lobe formation. Red and green segments correspond to the segments shown in A and B, respectively. D, A plot of lobe height defined as the orthogonal distance from the cell boundary to a reference line that connects the two three-way junctions. E, Absolute value of the lobe height in D color coded with a heat map to reflect differing lobe height along the segment length. F, Heat map of lobe height of segment III as a function of normalized segment length (x axis) over time (y axis). The red star shows new lobe formation.

