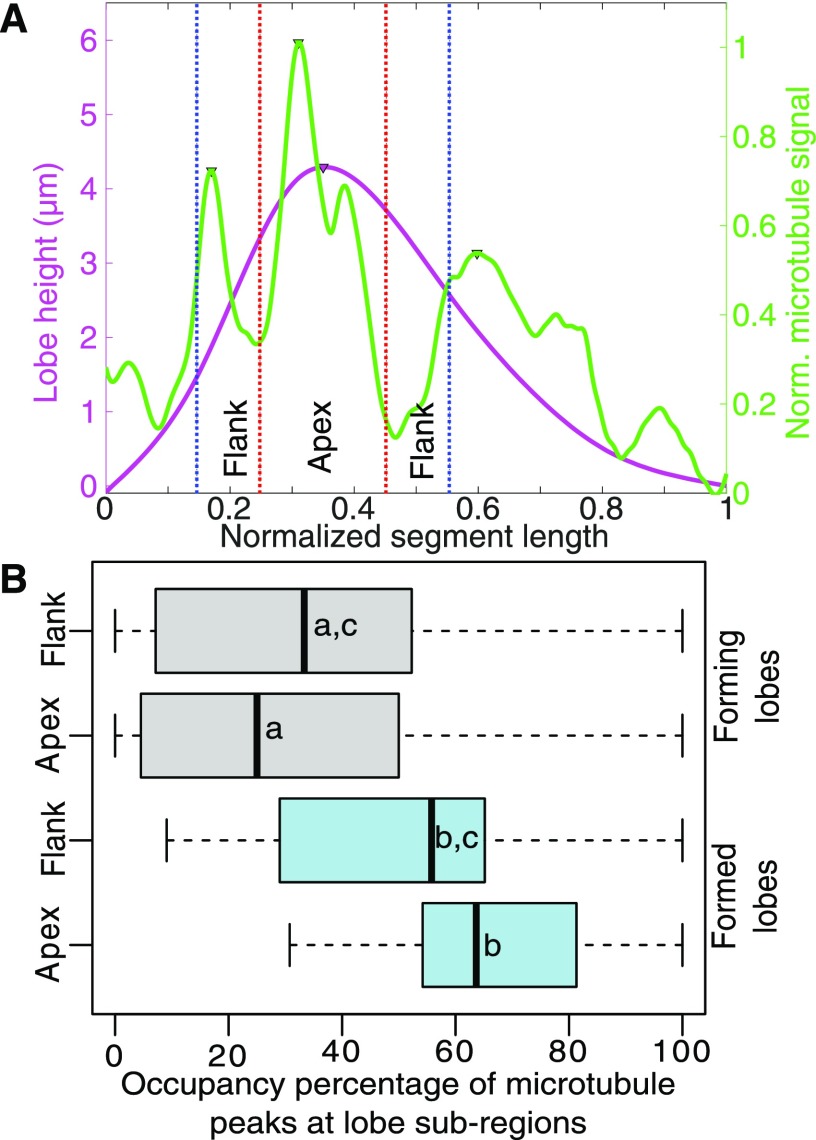
Figure 6.
The microtubule peak occupancy at the lobe apex is not significantly higher than that of the adjacent flank regions. A, Example of lobe subdivision based on the lobe width (W) at half-maximal lobe height. The apex is 1/2 W centered at the lobe apex. The flank region total width is 1/2 W surrounding the apex region. B, Population-level analysis of microtubule signal peak occupancy for recently formed lobes (forming) and lobes present at the start of the time series (formed). Letters represent statistically equivalent groups.

