Figure 2.
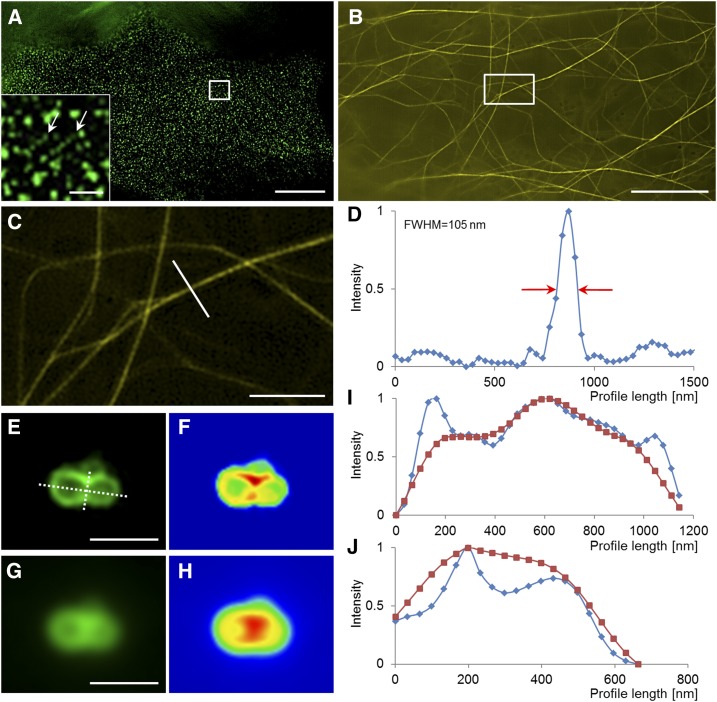
The superresolution potential of structured illumination microscopy applied to subcellular live imaging of plants. A, Imaging of Flot1 clusters at the plasma membrane of an Arabidopsis cotyledon pavement cell expressing a GFP-Flot1 marker. The inset shows two linear clusters of Flot1 particles (arrows). B to D, Imaging of the actin cytoskeleton in a hypocotyl epidermal cell expressing a YFP-FABD2-YFP actin marker (B; the boxed area is magnified in C) with the capacity to resolve fine actin bundles at approximately 100 nm at full width at half-maximum (FWHM) of the intensity profile (D) shown in C. E to J, Visualization of late endosome fusion with SIM imaging in root epidermal cells or Arabidopsis expressing a GFP-FYVE late endosomal reporter (E and F) as compared with wide-field epifluorescence (G and H). The graphic depiction of the longitudinal (I) and the transverse (J) profiles, drawn as dotted lines in E, highlights the potential of SIM to identify the area of fusion as an area of decreased fluorescence intensity. Bars = 10 μm (A and B), 2 μm (C), and 1 μm (E, G, and inset in A).

