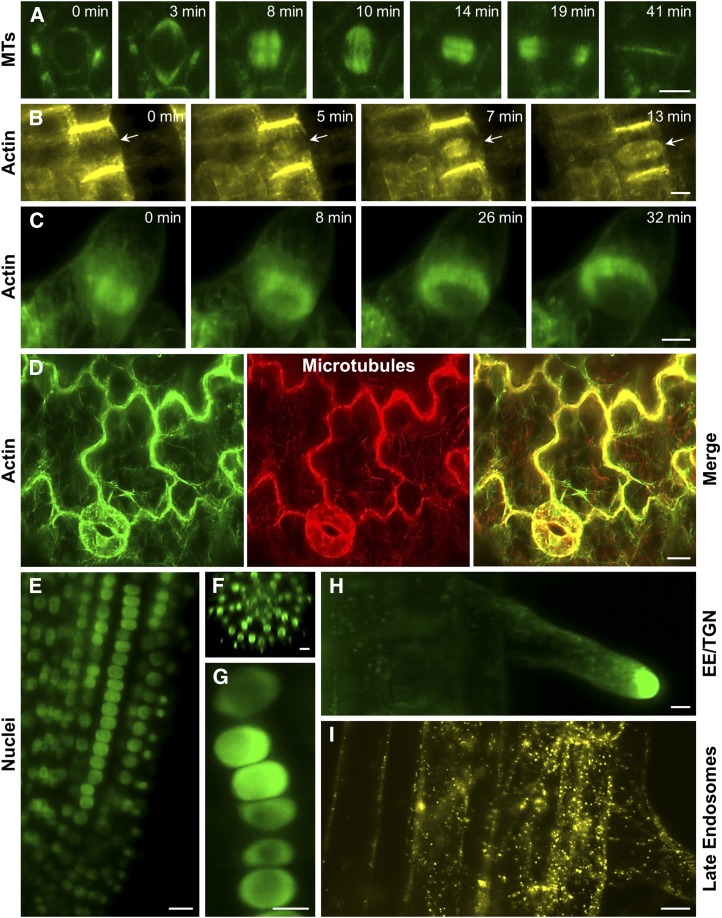
Figure 6.
Advances of LSFM imaging of dynamic cellular and developmental processes in plants. A, Imaging of microtubules (MTs) in a time-course recording of a dividing Arabidopsis root epidermal cell as visualized using a GFP-TUA5 marker. B, Time-course imaging of actin in phragmoplast of a dividing Arabidopsis root epidermal cell (arrows) as visualized using a YFP-FABD2-YFP marker. C, Time-course imaging of actin in phragmoplast of a dividing BY-2 suspension cell as visualized using a GFP-Lifeact marker. D, Covisualization of actin using GFP-FABD2 and microtubules using mCherry-TUA5 in cotyledon stomata and pavement cells of Arabidopsis. E to G, Localization of EB1c in nuclei of Arabidopsis root as visualized using an EB1c-GFP marker. The high potential of LSFM for deep tissue imaging provides insight into EB1c-GFP nuclear localization in cells of different developmental zones (E), different root cell layers (F), as well as in individual cell files (G). H, Localization of the small Rab GTPase RabA1d in early endosomal-trans-Golgi network (EE-TGN) compartments accumulating at the tip of growing root hairs as visualized using a GFP-RabA1d marker. I, Imaging of late endosomes in Arabidopsis cortical and epidermal root cells as visualized using a YFP-RabF2a marker. Bars = 5 µm (A, B, and G–I) and 10 µm (C–F).

