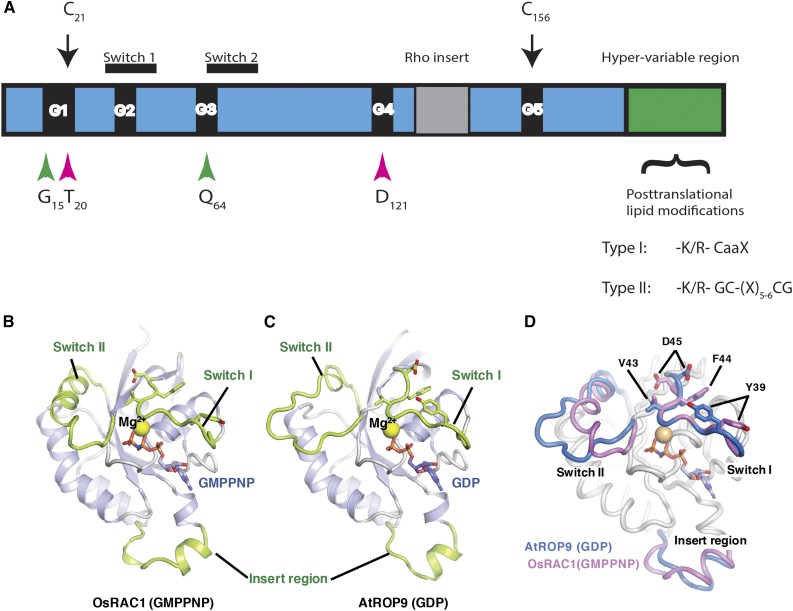
Figure 2.
Structures of ROPs. A, Schematic model highlighting the conserved G-box motifs (G1–G5), switch I and II domains, the insert region, and the HVR. The positions of the conserved residues mutated in the constitutively active and dominant-negative mutations are highlighted by green and magenta arrowheads, respectively. C21 and C156 are conserved G domain Cys residues that undergo activation-dependent transient S-acylation (black arrows). The HVR terminates with a canonical CaaX box geranylgeranylation motif and a PBR in type I ROPs or with a GC-CG box and a proximal PBR in type II ROPs. B, Three-dimensional structure of GTP-bound OsRAC1 [OsRAC1 (GMPPNP)]. C, Three-dimensional structure of the GDP-bound AtROP9 [AtROP9 (GDP)]. In B and C, the switch I, switch II, and insert regions are colored green. GMPPNP and GDP are shown as stick models (red, oxygen; blue, nitrogen; orange, phosphorus). The Mg2+ ions are shown as yellow spheres. D, Superimposed structures of OsRAC1 (GMPPNP) and AtROP9 (GDP). The main chains of OsRAC1 (GMPPNP) and AtROP9 (GDP) (chain B; Protein Data Bank code 2J0V) were superimposed using PyMOL. Regions of the OsRAC1 and AtROP9 proteins are colored blue and pink, respectively. The side chains of four key switch I residues in OsRAC1 (Val-43, Phe-44, Asp-45, and Tyr-39) and equivalent residues in AtROP9 (Val-39, Phe-40, Asp-41, and Tyr-35) are shown in stick representation. B to D were prepared and contributed by Izuru Ohki and Chojiro Kojima and are based on their article describing the structure of GTP-bound OsRAC1 (Kosami et al., 2014).

