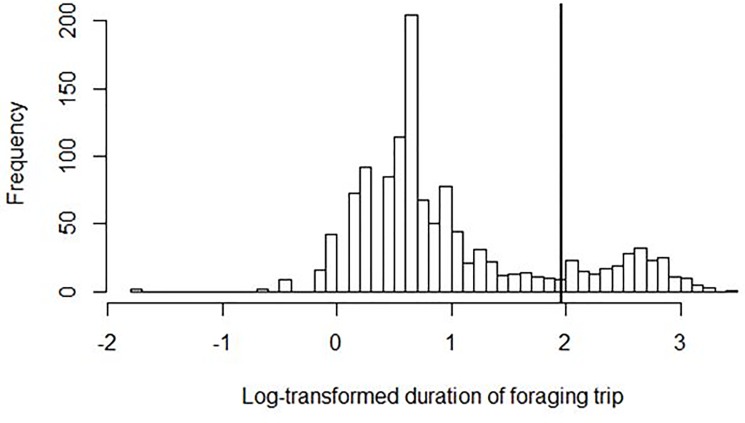
Fig 1. Distribution of log-transformed duration of the dovekie foraging trips.
The vertical line indicates a cut-off value (log of 7.1 hours) to separate short and long trips, following the algorithm that minimizes the sum of the variances of both types of trips given their log-normal distribution [31].

