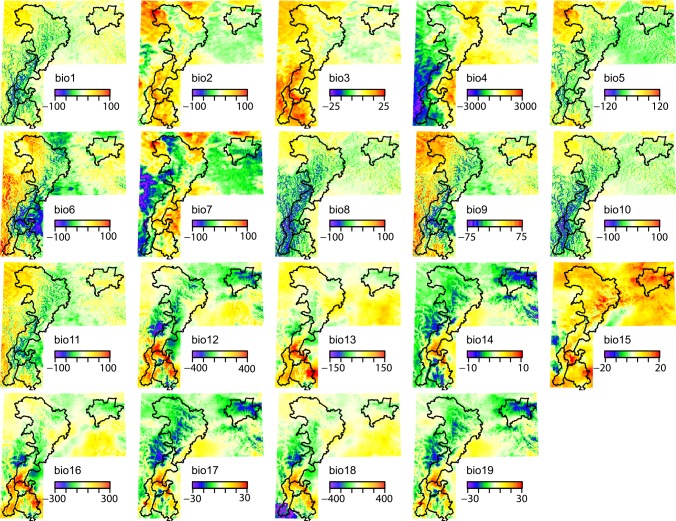
Fig 2. Difference between the remotely-sensed (RS) and WorldClim (WC) datasets for 19 bioclimatic variables generated from temperature (units of °C * 10) and precipitation (units of mm).
Positive differences indicate higher values for the RS dataset, and negative differences indicate higher values for the WC dataset. The outlines on each panel are the boundaries of the different mountain ranges and are provided for reference. The bioclimatic variables are long-term averages of annual mean temperature (bio1); mean diurnal range (bio2); isothermality (bio3); temperature seasonality (bio4); maximum temperature of the warmest month (bio5); minimum temperature of the coldest month (bio6); annual temperature range (bio7); mean temperature of the wettest (bio8), driest (bio9), warmest (bio10), and coldest (bio11) quarter; annual precipitation (bio12); precipitation of the wettest (bio13) and driest (bio14) month; precipitation seasonality (bio15); and precipitation of the wettest (bio16), driest (bio17), warmest (bio18) and coldest (bio19) quarter.

