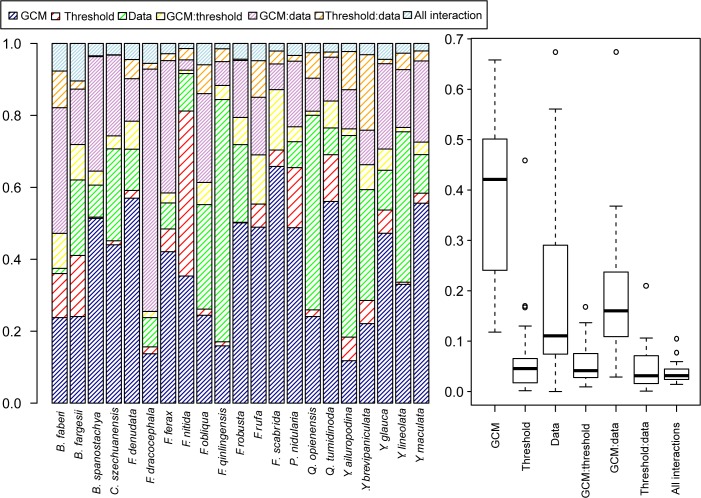
Fig 8. Proportion of sum-squared error to total squared error for a three-way analysis of variance (ANOVA) of the projected change in suitable area for each of the 21 bamboo species (left), and summarized over all 21 bamboo species (right).
The analysis includes two model calibrations developed from the WorldClim (WC) and remotely-sensed (RS) datasets and using four bioclimatic variables as predictors (referred to as WC4 and RS4), 17 future climate projections downscaled from global climate models (GCMs), and 11 conversion thresholds.

