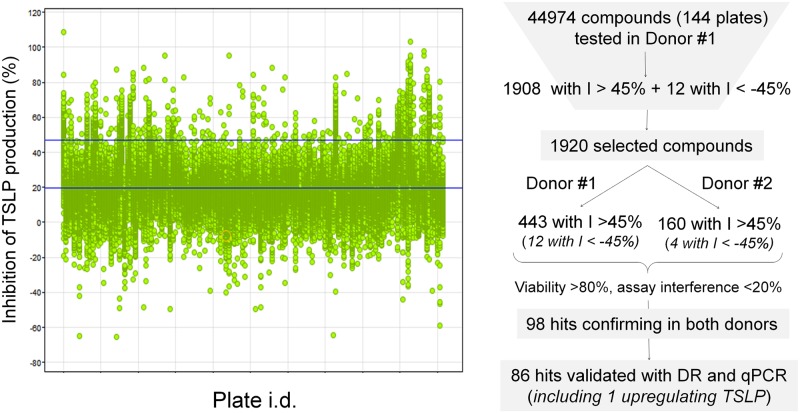
Fig 3. Overview of the screening and confirmation process.
Left panel shows % inhibition of TSLP production (vertical axis) for all screened compounds distributed by plates (horizontal axis). Upper horizontal blue line in the left panel indicates cut off value for hit selection (45%). Right panel is a summary of the hit selection process (DR = dose response evaluation, I = inhibition).

