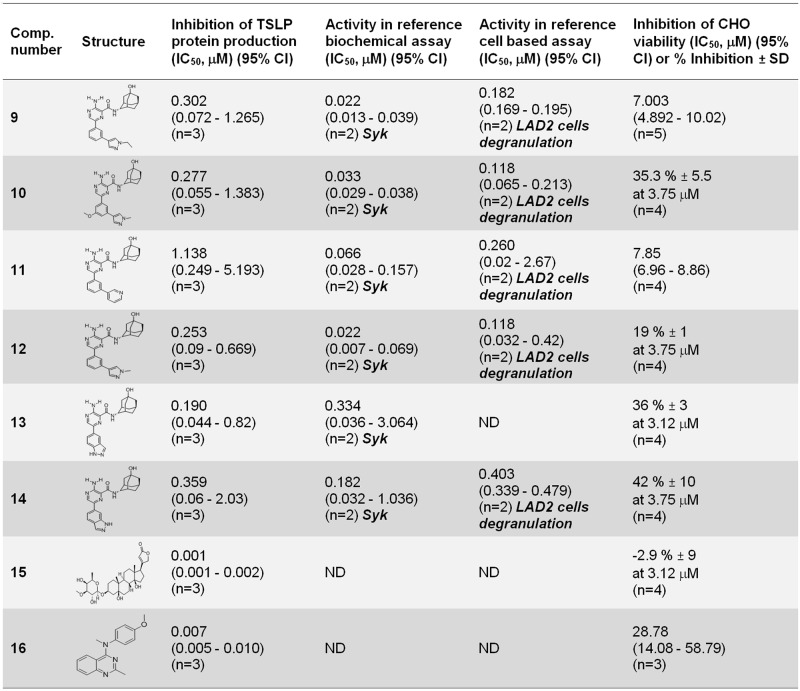
Fig 8. Active compounds identified in the hit expansion exercise.
Results obtained using NHBE cells from donor #1 in the TSLP assay. Results shown as geometric mean IC50, μM (95% confidence interval) or average % inhibition ± SD at the indicated concentration. Biochemical and cell based specific activities evaluated are indicated in each case and shown in bold.

