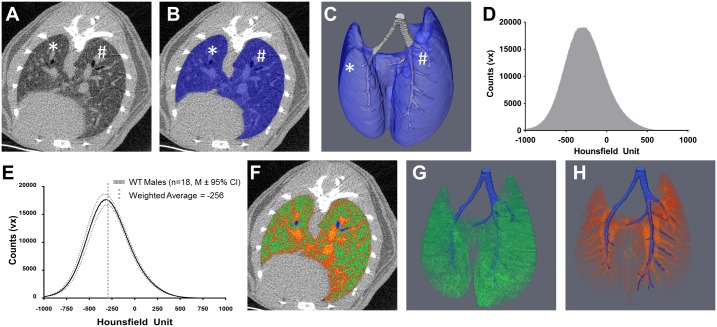
Fig 1. In vivo micro-CT quantification of aerated and tissue lung volume.
A) A 2D representative μCT transverse, inferior cross section of a WT lung at cervical vertebra 8 shows the margin of the lung inside of the abdominal cavity. B) This margin is then used with semi-automated tools in Amira to segment the lung (Blue overlay) and a 3D reconstruction can be generated (C). The lung is further segmented into the conducting airway (Grey, C) and into the left (*) and right (#) lobes for more specific analysis (A-C). The raw intensity values from either the whole lung segment or a smaller portion are extracted to generate intensity histograms (D). To delineate aerated lung volume from tissue lung volume a thresholding operation must be developed. The most abundant volume in a healthy lung is the interface between air and the alveolar epithelium. As measured by μCT, the most abundant density in 3–12 month old WT mice is -256 HU (E). Using this threshold, aerated and tissue lung volume can be quantified as shown in a representative 2D overlay (F, Green = Aerated Volume, Orange-Red = Tissue Volume, Blue = Conducting Airway) and 3D reconstructions (G, Aerated Volume; H, Tissue Volume, Blue = Conducting Airway). Note the distinct bronchiole and arteriole structures in G and H.

