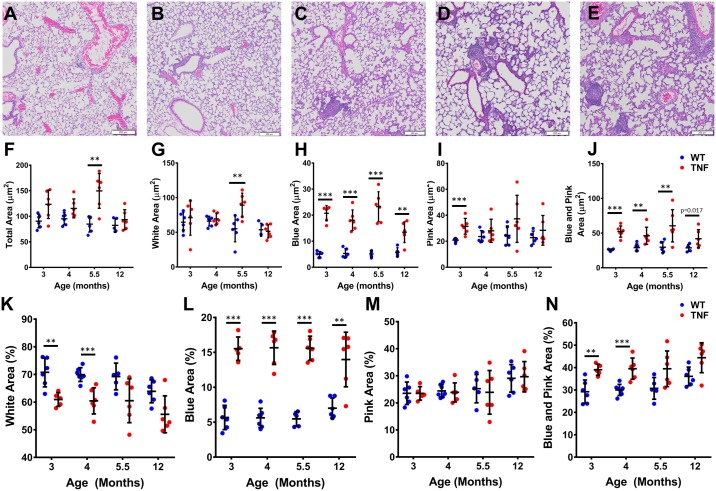
Fig 4. TNF-Tg male mice have greater tissue area compared to WT litter mates measured via histomorphometry.
Blue, Pink and White areas were measured on 3 sections >200 μm apart for 3, 4, 5.5, and 12-month-old male TNF-Tg and WT littermates. Representative H and E images from a 12-month WT (A), and 3 (B), 4 (C), 5 (D) and 12 (E) month TNF-Tg mice show a clear increase in cells in the TNF-Tg mice at all timepoints. Quantifying each histomorphometric category demonstrates a significant increase in Total area at 3 and 5.5 months (F), Blue area at all timepoints (G) and Blue + Pink at 3, 4, and 5.5 months (H) for TNF-Tg mice compared to their WT littermates. Due to the known volumetric changes that occur in the histologic processing solutions (i.e. formalin, ethanols) and the nature of lung tissue being sensitive to changes due to its composition, we normalized all the measurements to the total area (I, J, K and L). As expected, percent Blue area (J) at all timepoints and percent Blue + Pink (L) at 3, 4 and 5.5 months were significantly increased in TNF-Tg mice compared to WT littermates. Interestingly, when normalized to total area, there was a significant decrease in the White area at 3, 4, and 5.5 months in TNF-Tg mice compared to WT littermates (K; *p<0.0125, **p<0.01, ***p<0.001, M±SD, n = 4–6).

