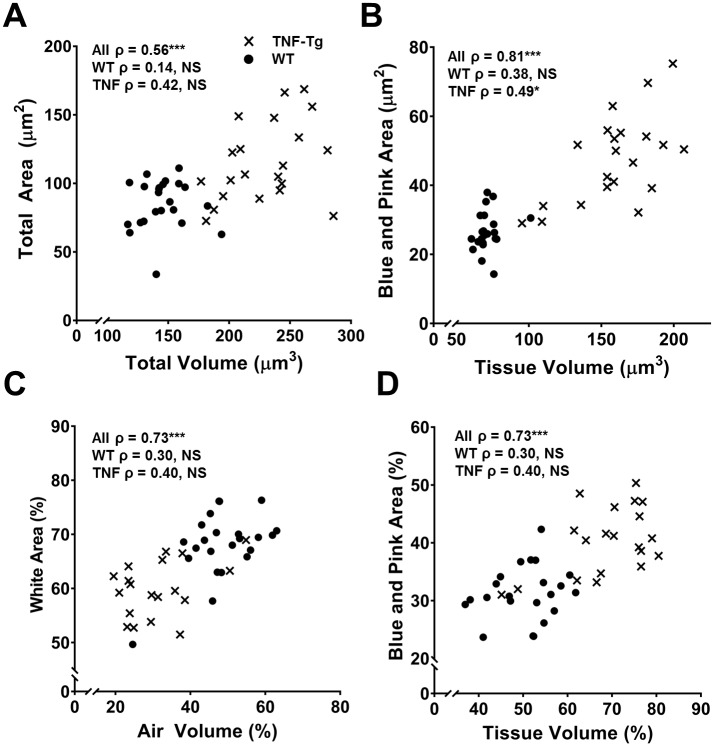
Fig 5. Tissue volume and tissue area (Blue + Pink) are highly correlated.
Spearman’s correlations were performed comparing μCT outcome measures and histomorphometry outcome measures. Both total volume and total area (A) as well as tissue volume and Blue + Pink (C) area were highly correlated with each other. Aerated volume and White area were not correlated (Not Shown); however, when normalized to total volume and area (C), there was a significant correlation. Normalized tissue volume and Blue + Pink area remained correlated (D). Spearman Rank coefficients are present on each graph for all data points (All ρ) and for each genotype independently (WT ρ, TNF-Tg ρ, X = TNF-Tg, ● = WT, n = 43, NS = not significant, *p<0.05, ***p<0.0001).

