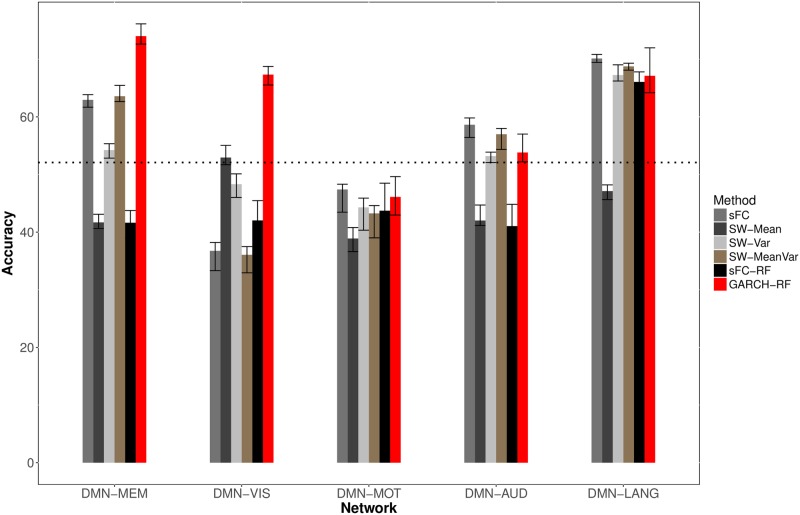
Fig 6. Predictive performance of dFC features.
Classification accuracy (TLE vs. controls) based on connectivity between DMN and various resting-state networks is shown. The horizontal line indicates the performance of a naïve classifer. The naïve classifer provides a baseline level of performance and classifies all test samples as the most common class in the training set. Static functional connectivity (sFC; cyan), dFC mean (SW-Mean; purple), dFC variance (SW-VAR; gray), dFC mean and variance (SW-MeanVar; green), static functional connectivity with random forests (sFC-RF), and proposed dFC approach (GARCH-RF; red). Mean and 95% CI over thirty replicates are shown.

