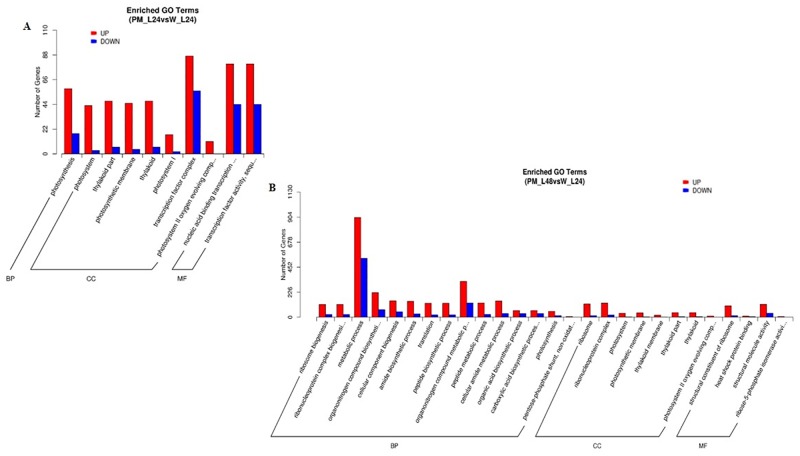
Fig 3. Enriched GO terms of DEGs.
A, DEGs at 24 h after PM inoculation compared with untreated control plants; B, DEGs at 48 h after PM inoculation compared with untreated control plants. The y-axis indicates the number of genes in a subcategory, and the x-axis indicates the different subcategories.

