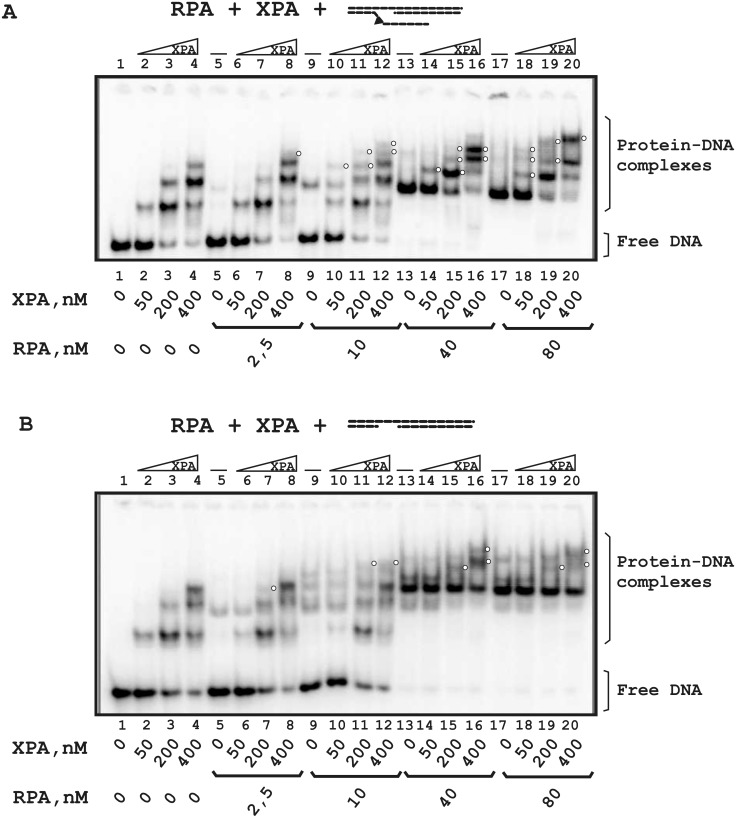
Fig 6. Comparative analysis of RPA and XPA binding to DNA containing a 10 nt gap with a flap (A) or a 10 nt gap only (B).
The reaction mixtures (10 μl) contained buffer A, 10 nM 5′-32P-labeled DNA and the indicated concentrations of proteins. A schematic view of the DNA structures is presented at the top: a triangle indicates the position of the bulky lesion. White circles indicate putative RPA-XPA-DNA complexes with unknown stoichiometry.

