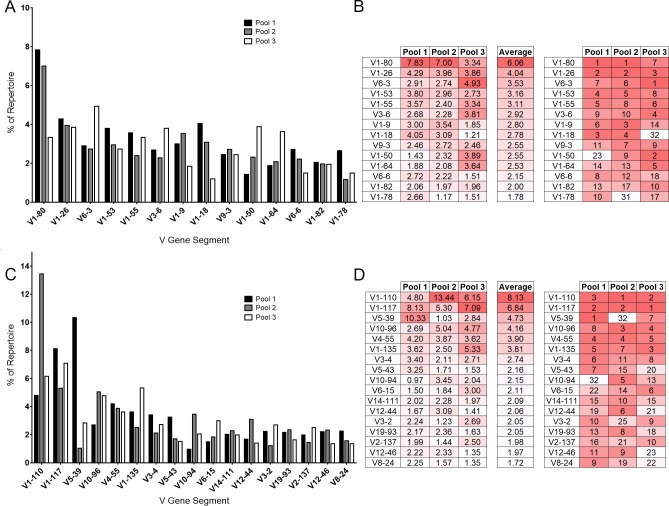
Fig 1. V-gene segment usage among unimmunized mouse pools.
Sequencing reads mapped to each individual gene segment were divided by the total sequencing reads of all identified gene segments from each mouse pool for a normalized comparison between pools. (A) The VH representing the ten most abundant gene segments from each mouse pool are displayed. (B) The rankings of each gene segment contained within the top 10 most abundant VH from at least one of the mouse pools are compared. The most abundant gene segment is ranked as 1. Dark red indicates higher rank moving to white, of lower rank. Similarly, the top 10 abundant Vκ are displayed (C-D).

