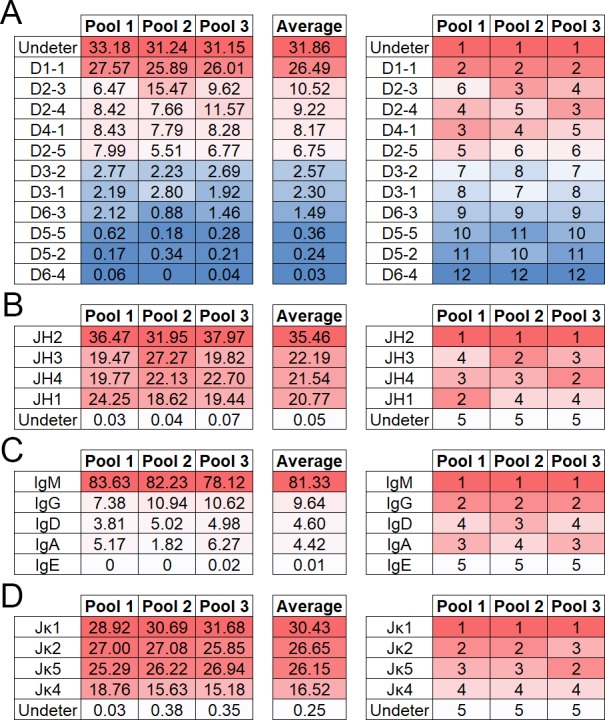
Fig 3.

Percent abundance of IgH D- (A) and J- (B) gene segments, IgH constant regions (C) and Igκ J-gene segments (D). Sequencing reads corresponding to each gene segment or constant region were divided by the total number of gene segments or constant regions identified in each mouse pool for normalized comparison between pools (left side). The most abundant gene segment is ranked as one (right side). Dark red indicates higher rank moving to blue (A) or white (B-D), of lower rank. Sequencing reads designated undetermined (undeter) where portions of a D- or J-gene segment were identified but unable to be assigned to a specific C57BL/6J D- or J-gene segment.
