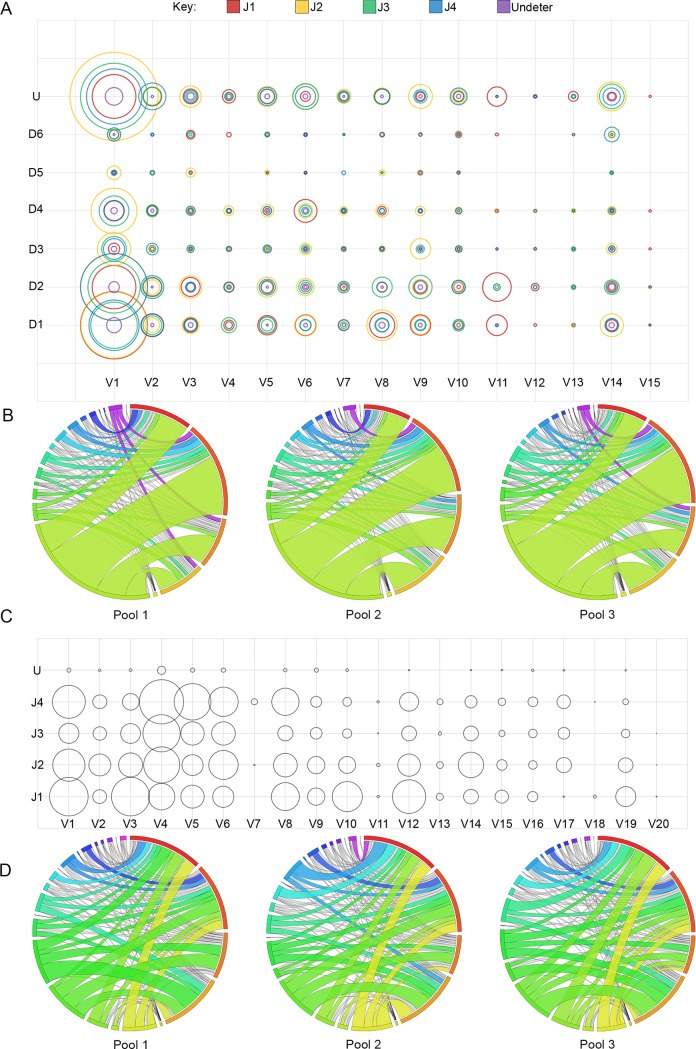
Fig 4.
Combinations of V-gene families with DJ-gene segments for IgH (A) and J-gene segments for Igκ (C). Increasing pairing frequency of V(D)J is represented by larger circles. Sequencing reads in which more than one C57BL/6 J-gene segment was attributed or too few nucleotides were present in the J-gene segment for designation by IMGT have been classified as undetermined (U). Pairing frequency is also represented by Circos graphs for IgH (B) and Igκ (D). Circos Plot Labels (starting at 12:00 position and the largest arc and continuing clockwise with occasional color references) B–J1 (red), J2, J3, J4, U (yellow), V1, V2, V3, V4, V5, V6, V7 (Teal), V8, V9, V10, V11, V12, V13, V14 (purple), V15 D–J1 (red), J2, J4, J5, U, V1 (yellow), V2, V3, V4, V5, V6, V7 (black sliver), V8, V9, V10, V11, V12, V13, V14, V15 (royal blue), V16, V17, V18, V19, V20 (black sliver, if present).

