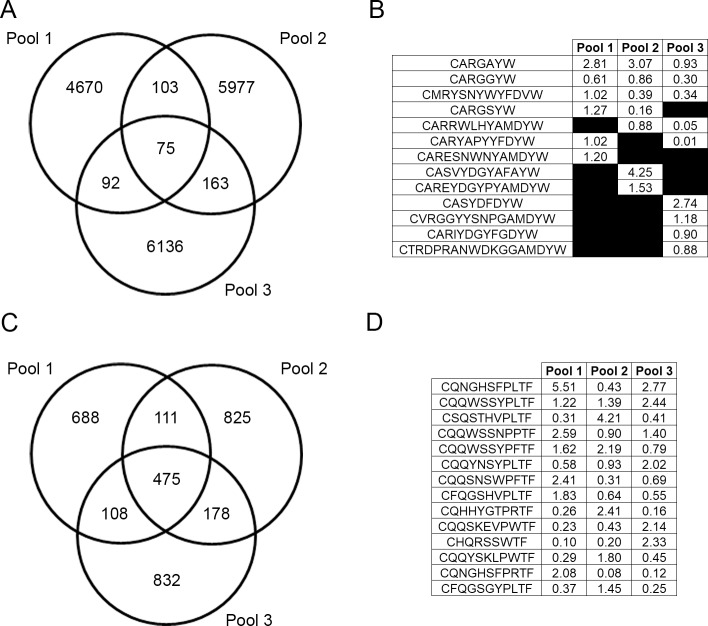
Fig 6. Top CDR3 AA sequences and overlap of unique CDR3 sequences within mouse pools.
A Venn diagram displays the overlap of the number of unique CDR3 amino acid sequences among mouse pools for IgH (A) and Igκ (C). The percent of repertoire for the top five CDR3 amino acid from each mouse pool are shown for IgH (B) and Igκ (D).

