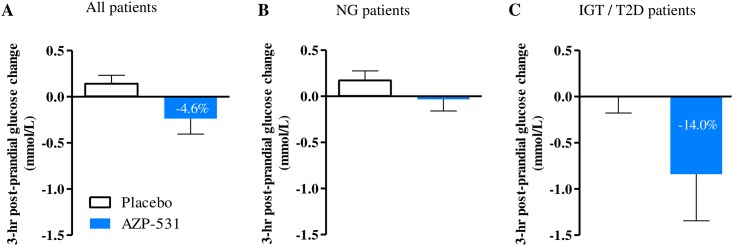
Fig 5. Post-prandial glucose change in treated patients from baseline to Day 14.
Mean values of the 3-hour post-prandial glucose change from baseline to Day 14 was plotted for all treated patients (Panel A), normoglycemic (NG) patients (Panel B), and patients with Impaired Glucose Tolerance or Type 2 Diabetes (IGT/T2D) (Panel C).

